
Venues, asset classes, and reference-asset groups: a data-driven view of RWA perpetual futures, prepared by RWA Foundation.
DATA AS OF OCTOBER 28, 2026, 30-DAY TRAILING FIGURES.
Overview
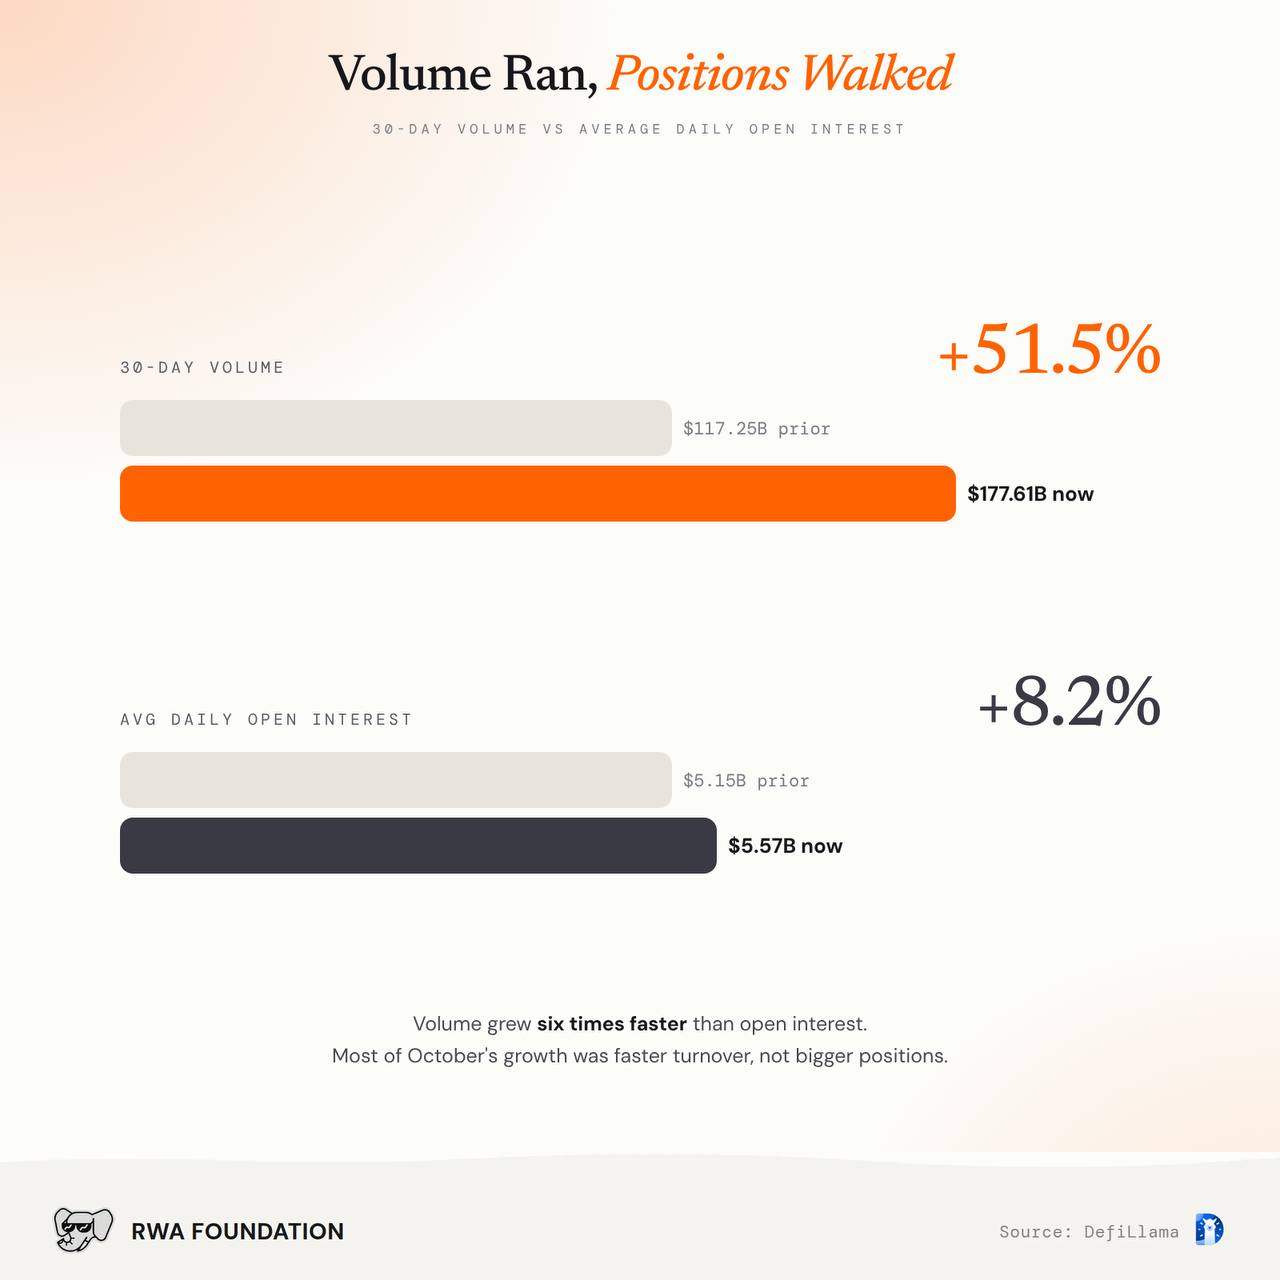
Volume grew six times faster than open interest. Most of October's growth came from markets turning over faster, led by index and currency perps.
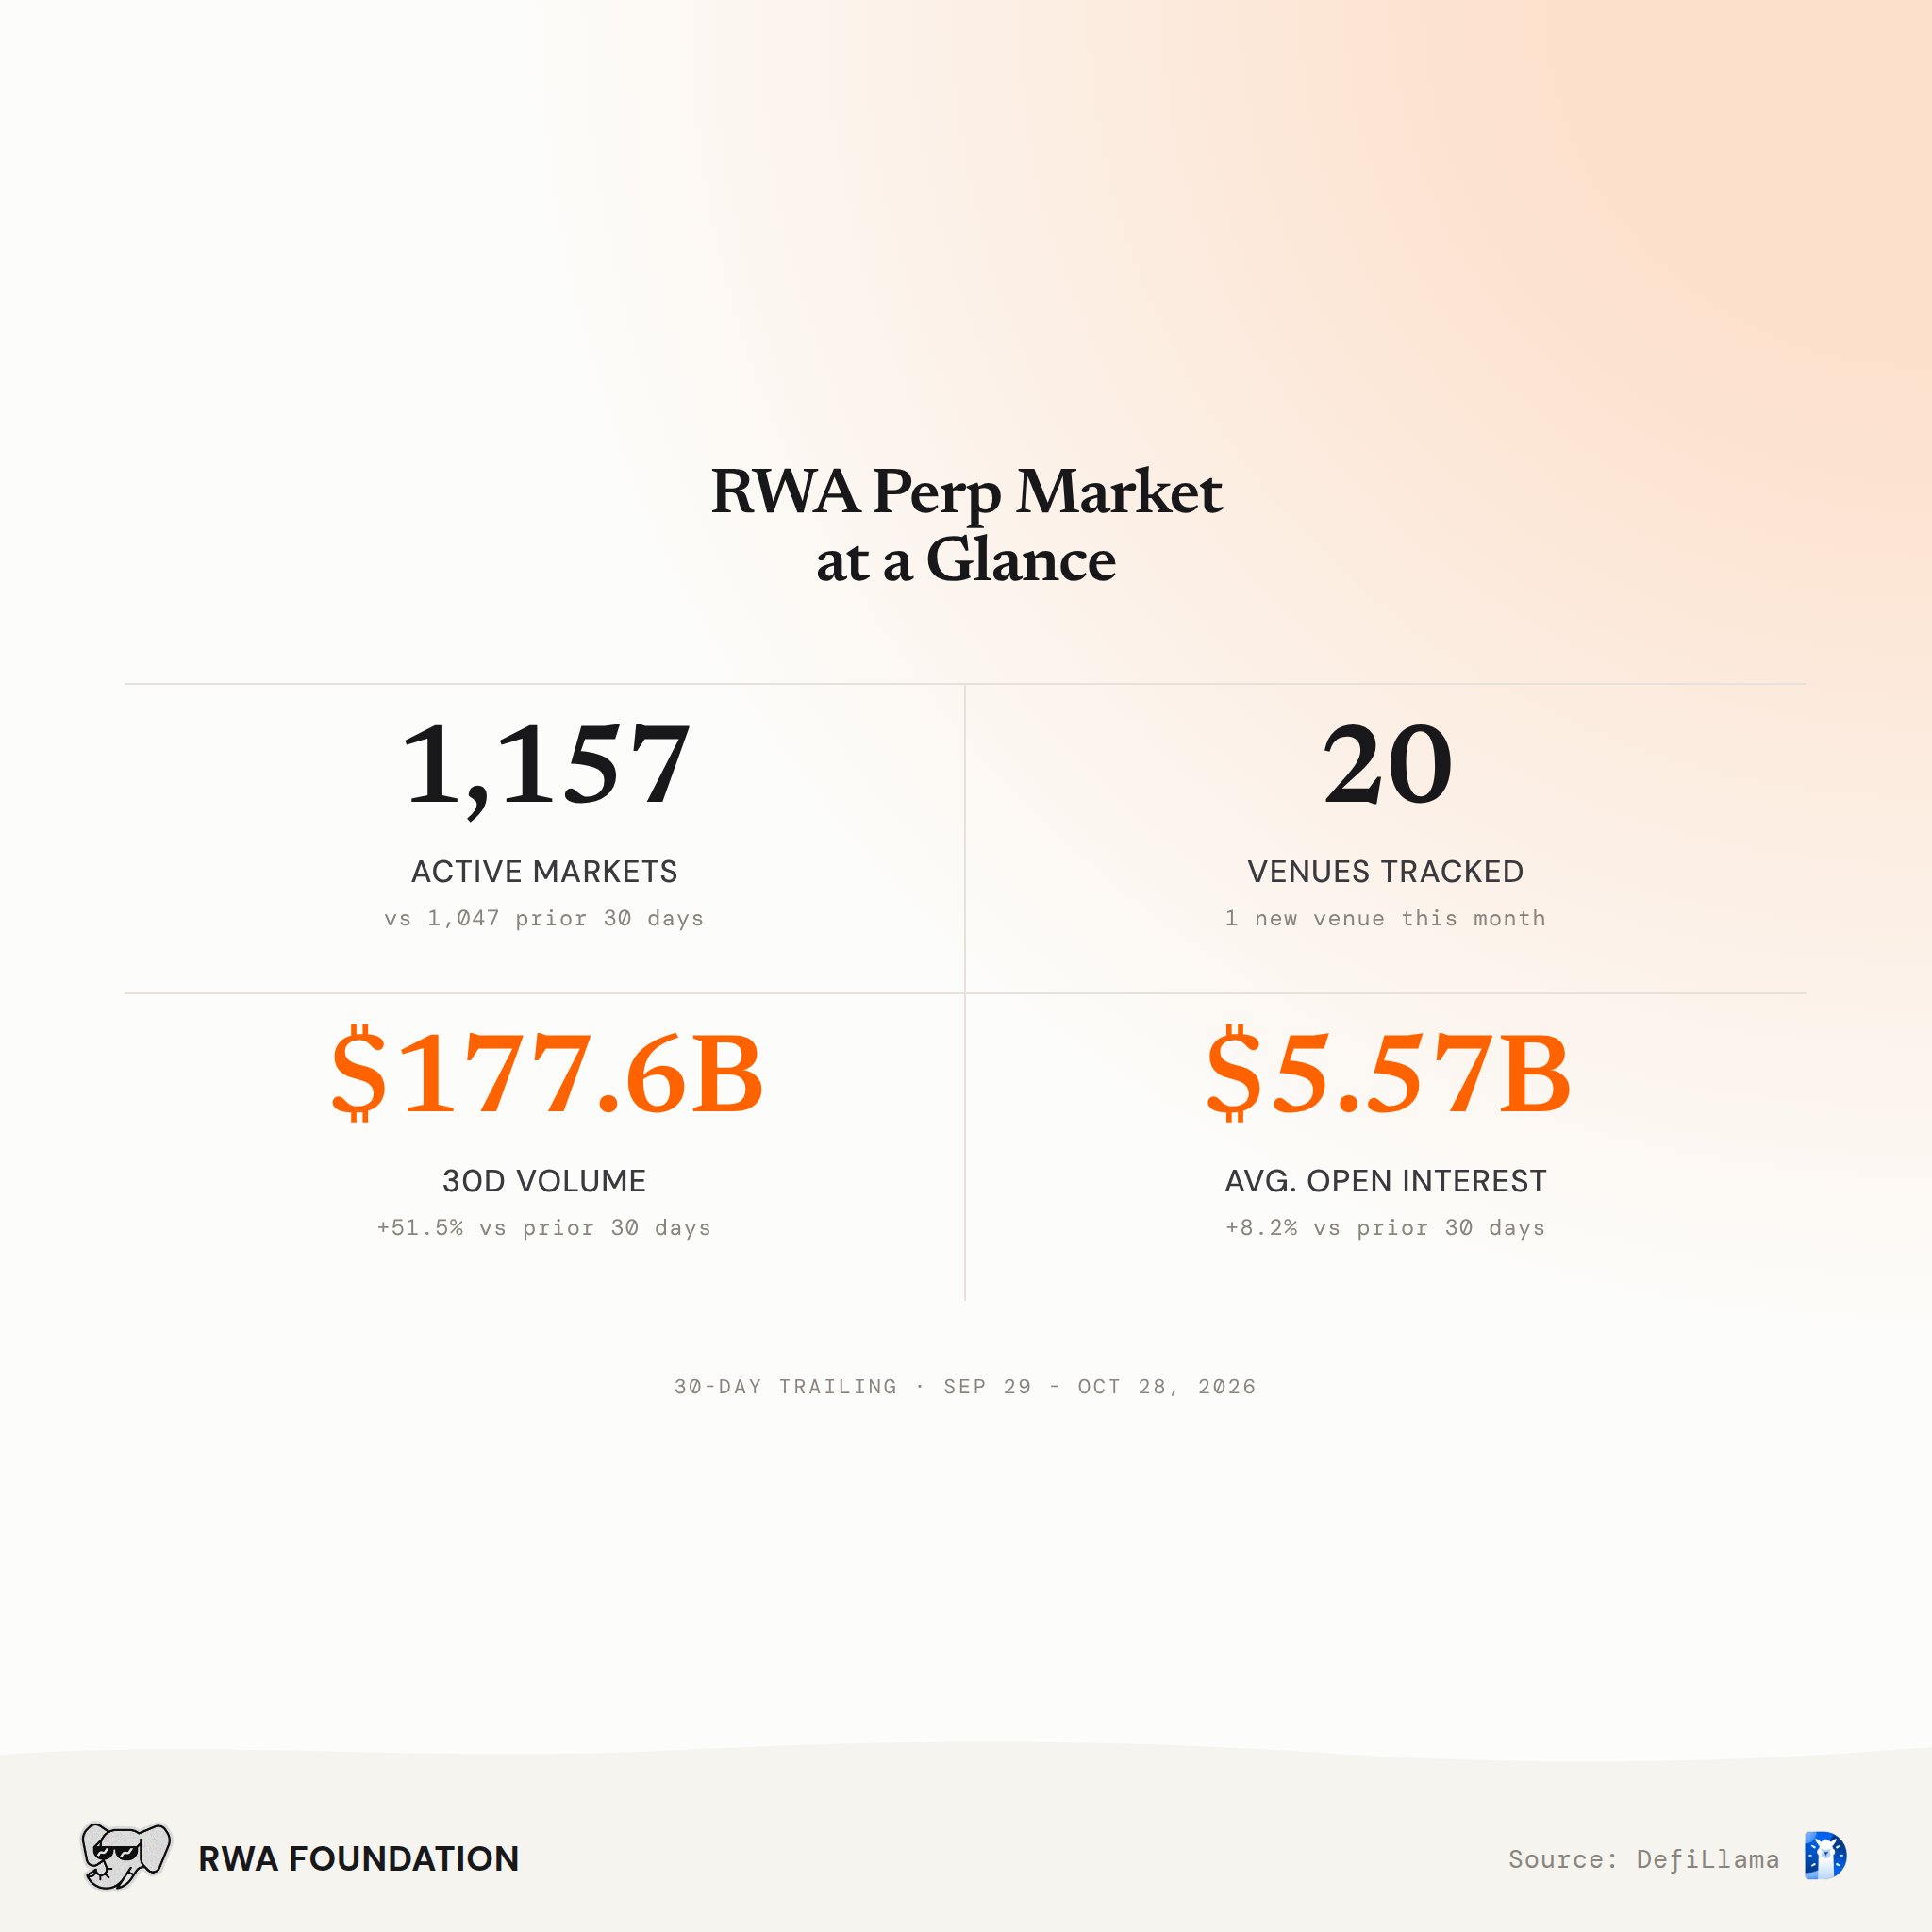
- $177.61B 30-day volume, up 51.5% from $117.25B
- $5.57B Average daily open interest, up 8.2%
- 1,157 Active markets across 20 venues
- $22.24B Added by three markets: Variational's Nasdaq-100 ($12.77B) and gmtrade's USD/CHF and USD/CAD ($9.47B)
Venues
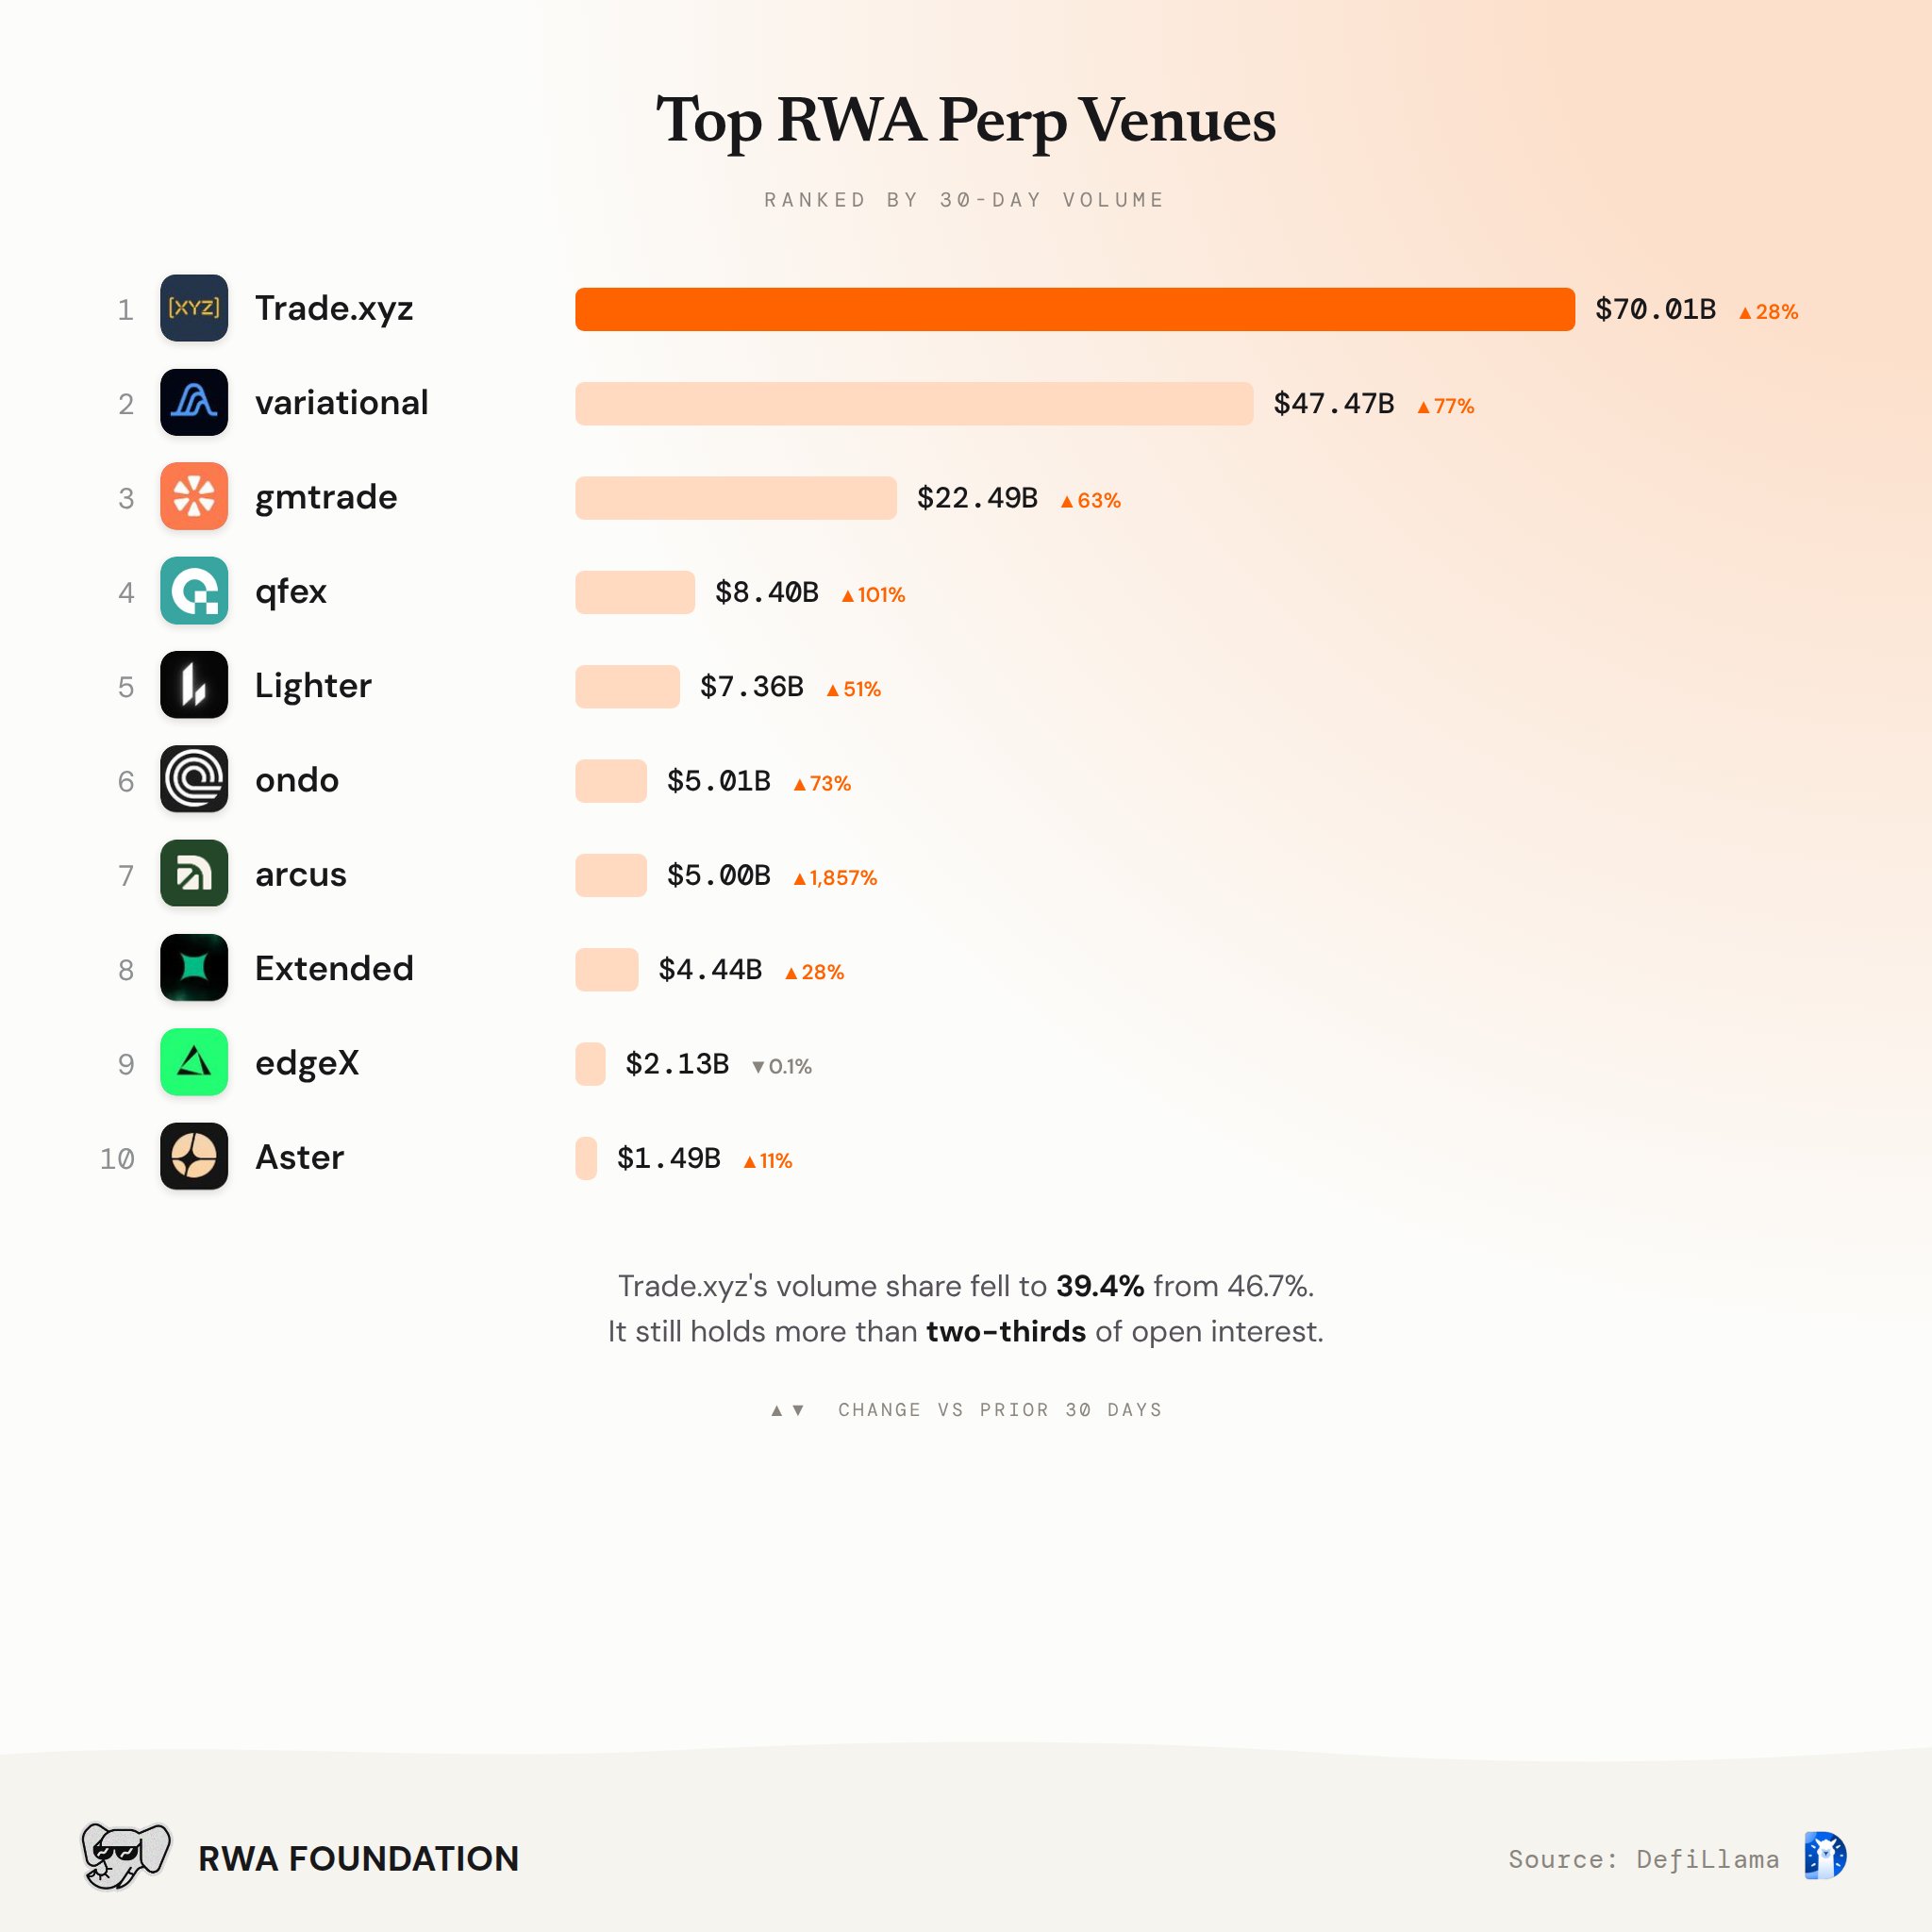
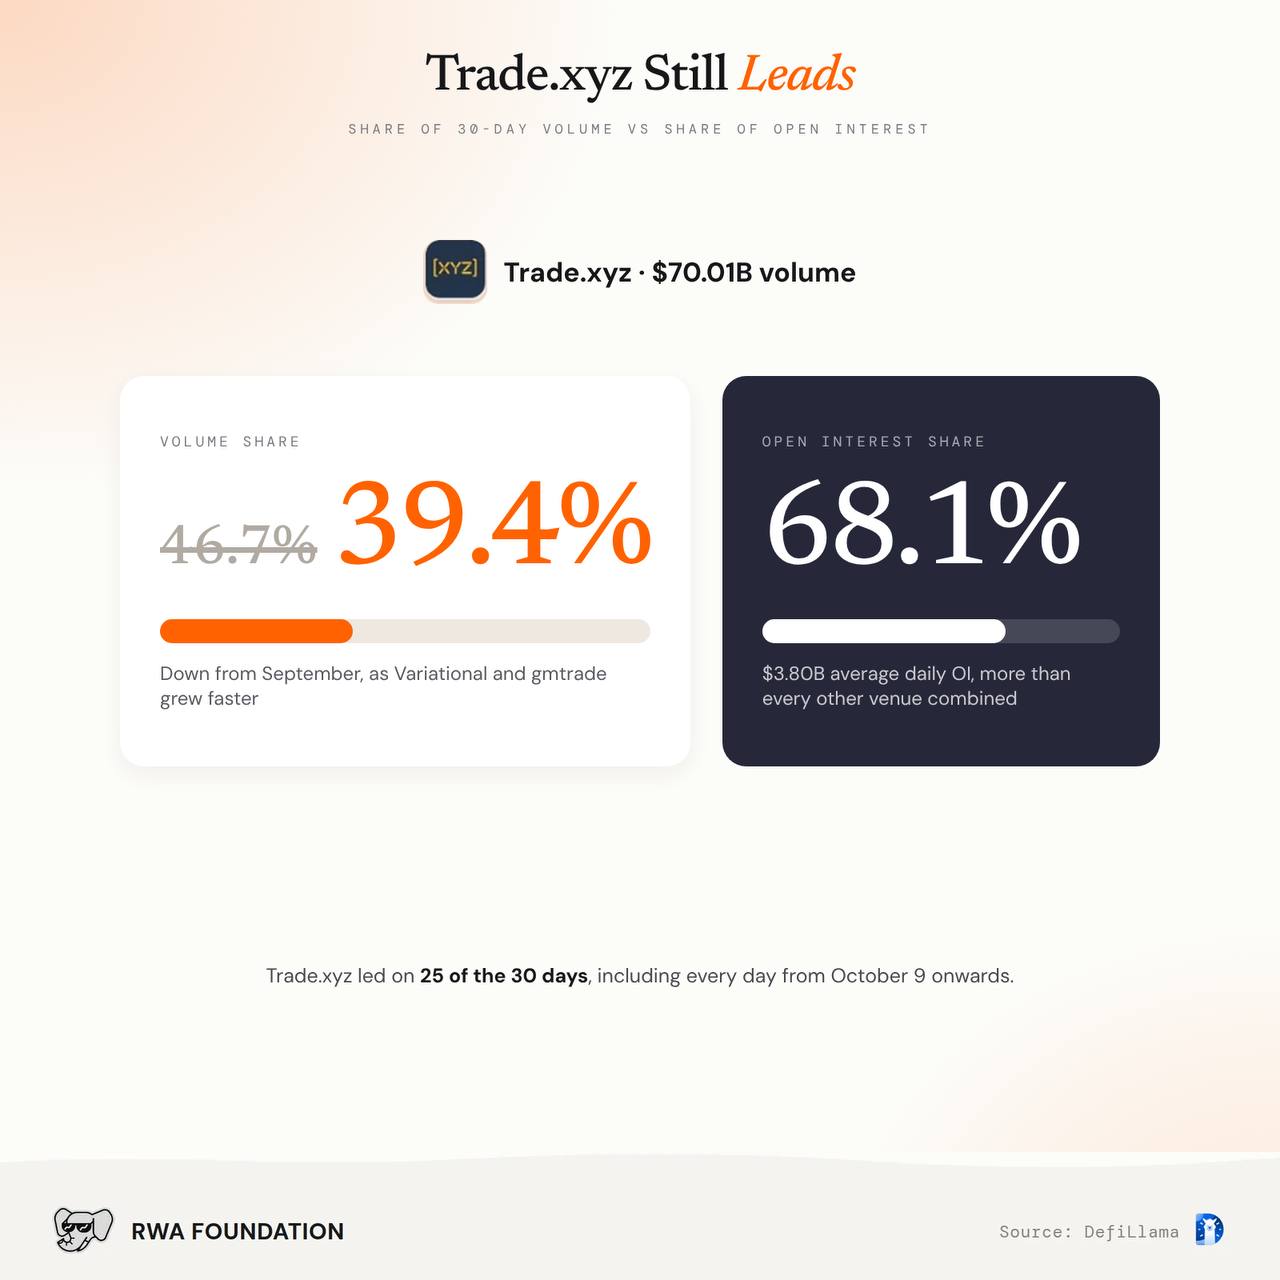
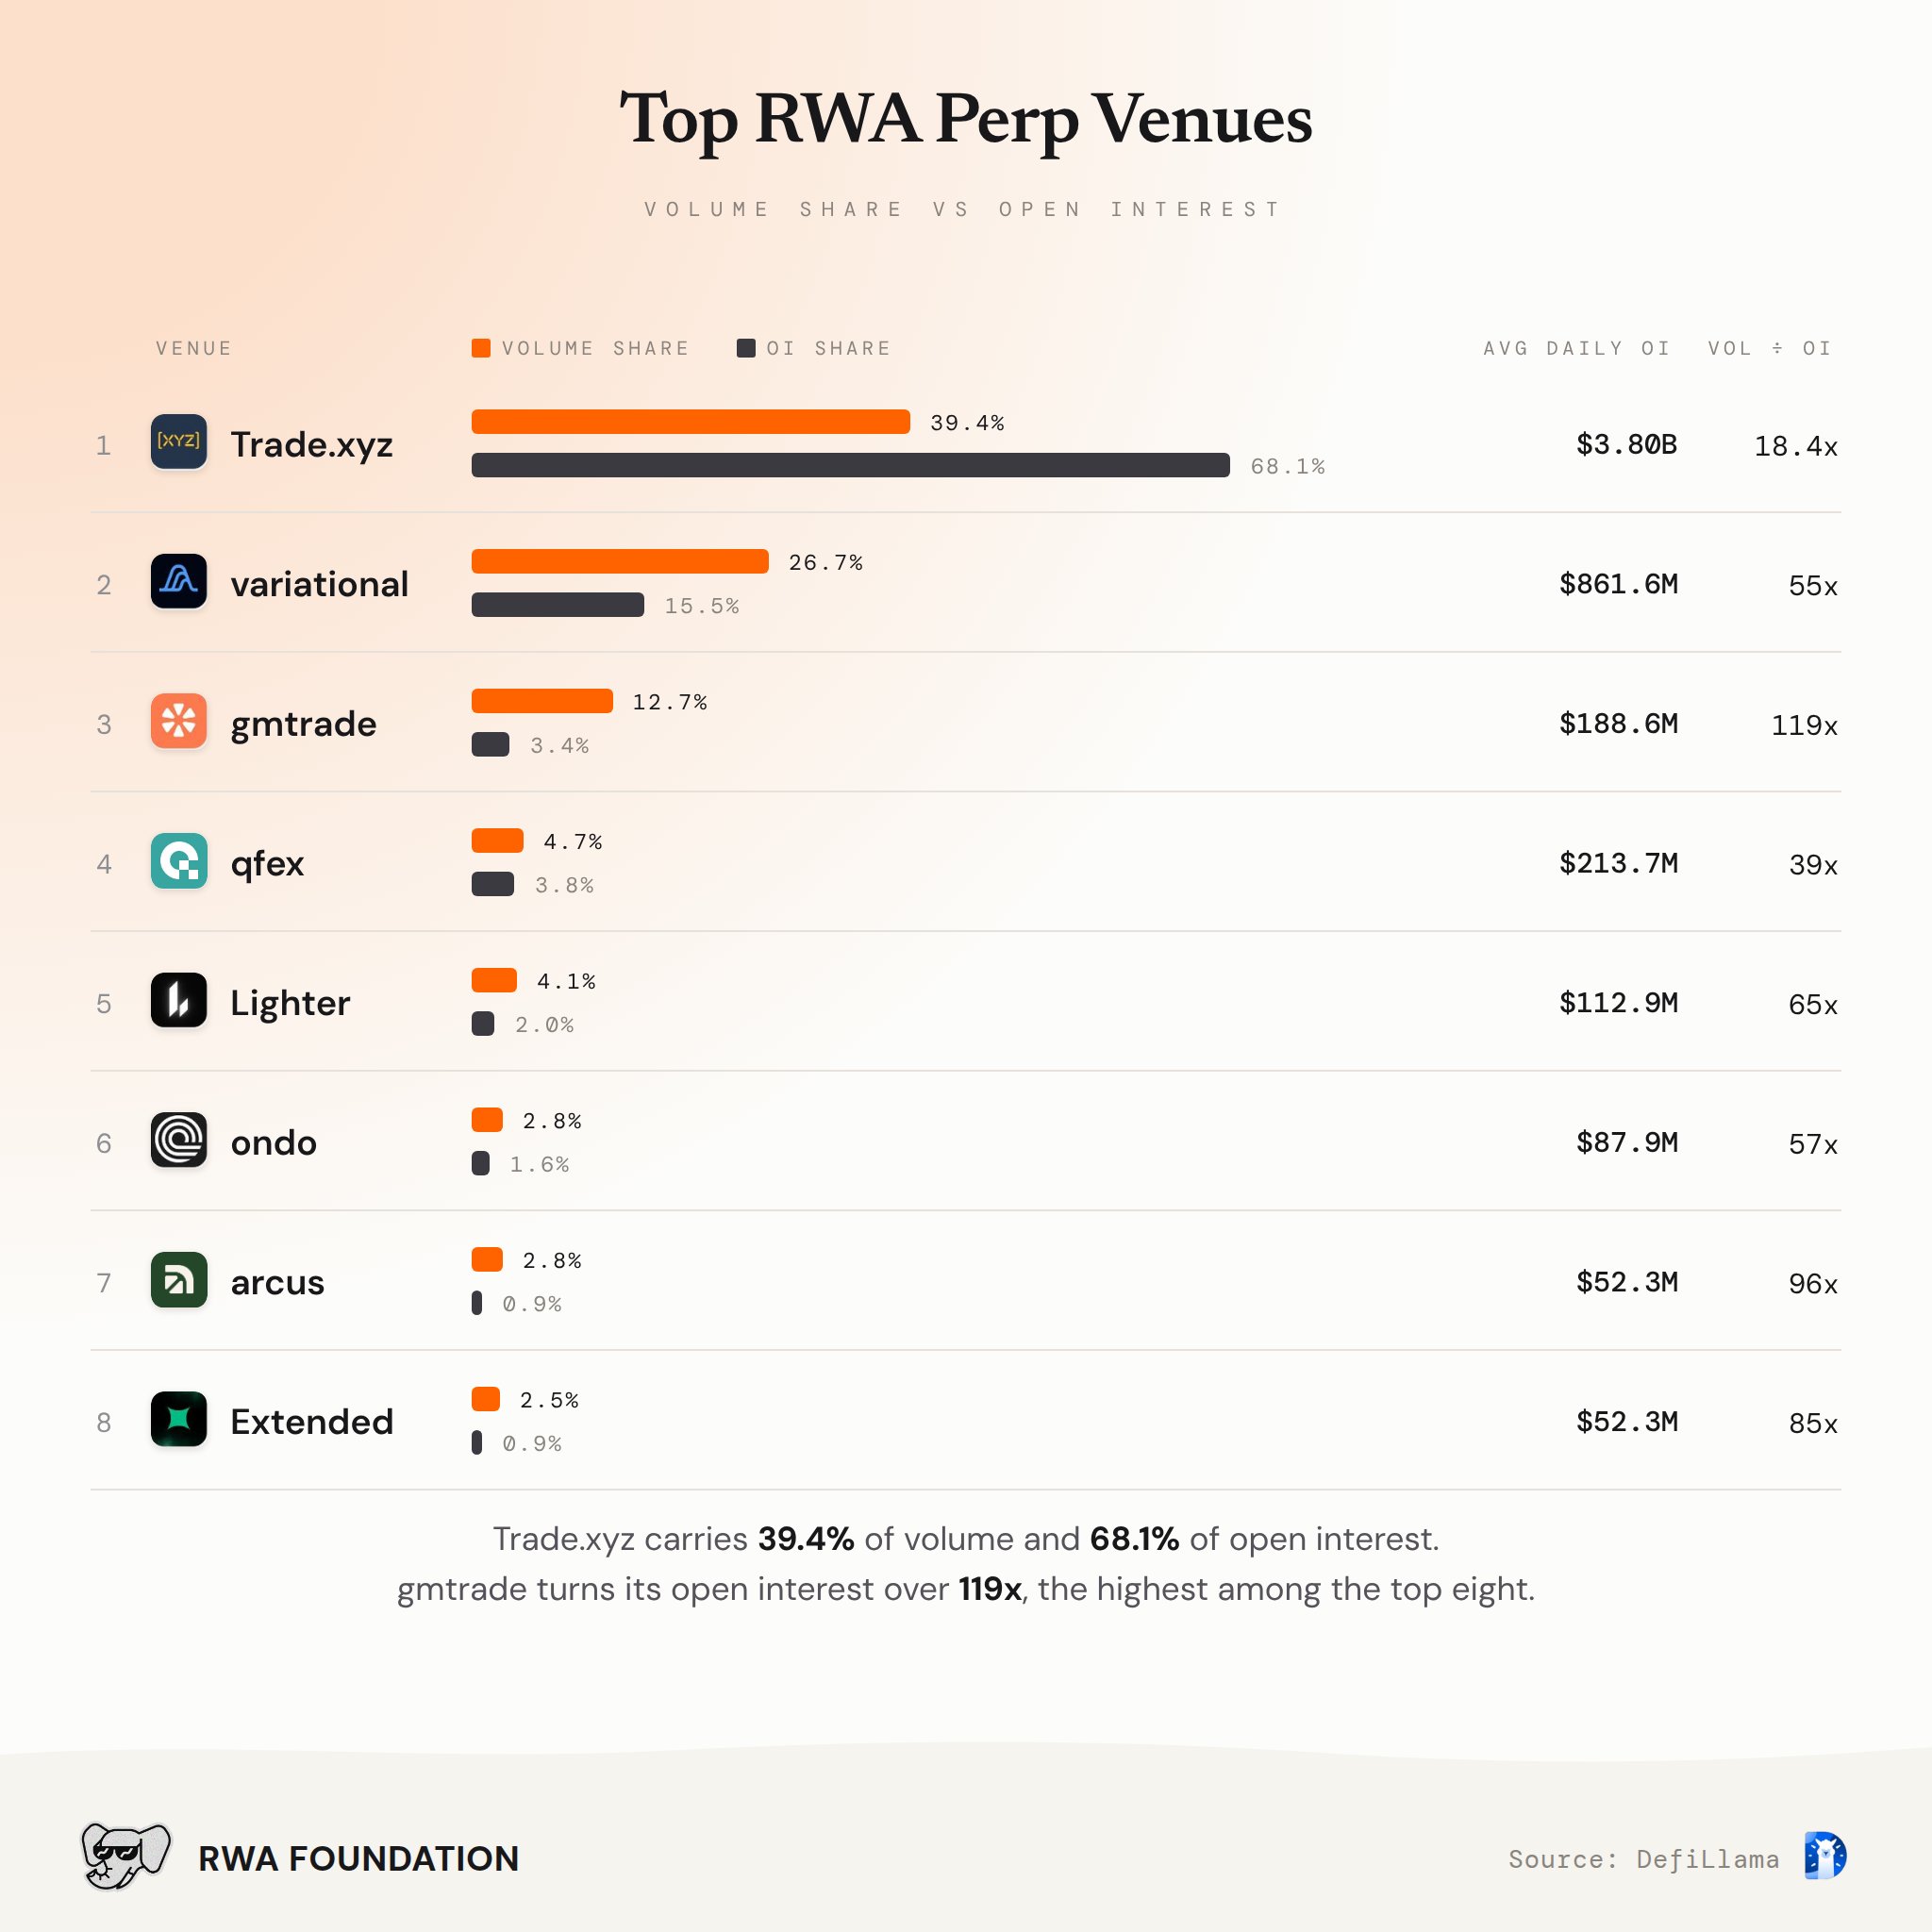
- 39.4% Trade.xyz share of volume, down from 46.7%. It still holds 68.1% of open interest
- 25 of 30 Days Trade.xyz led, including every day from October 9
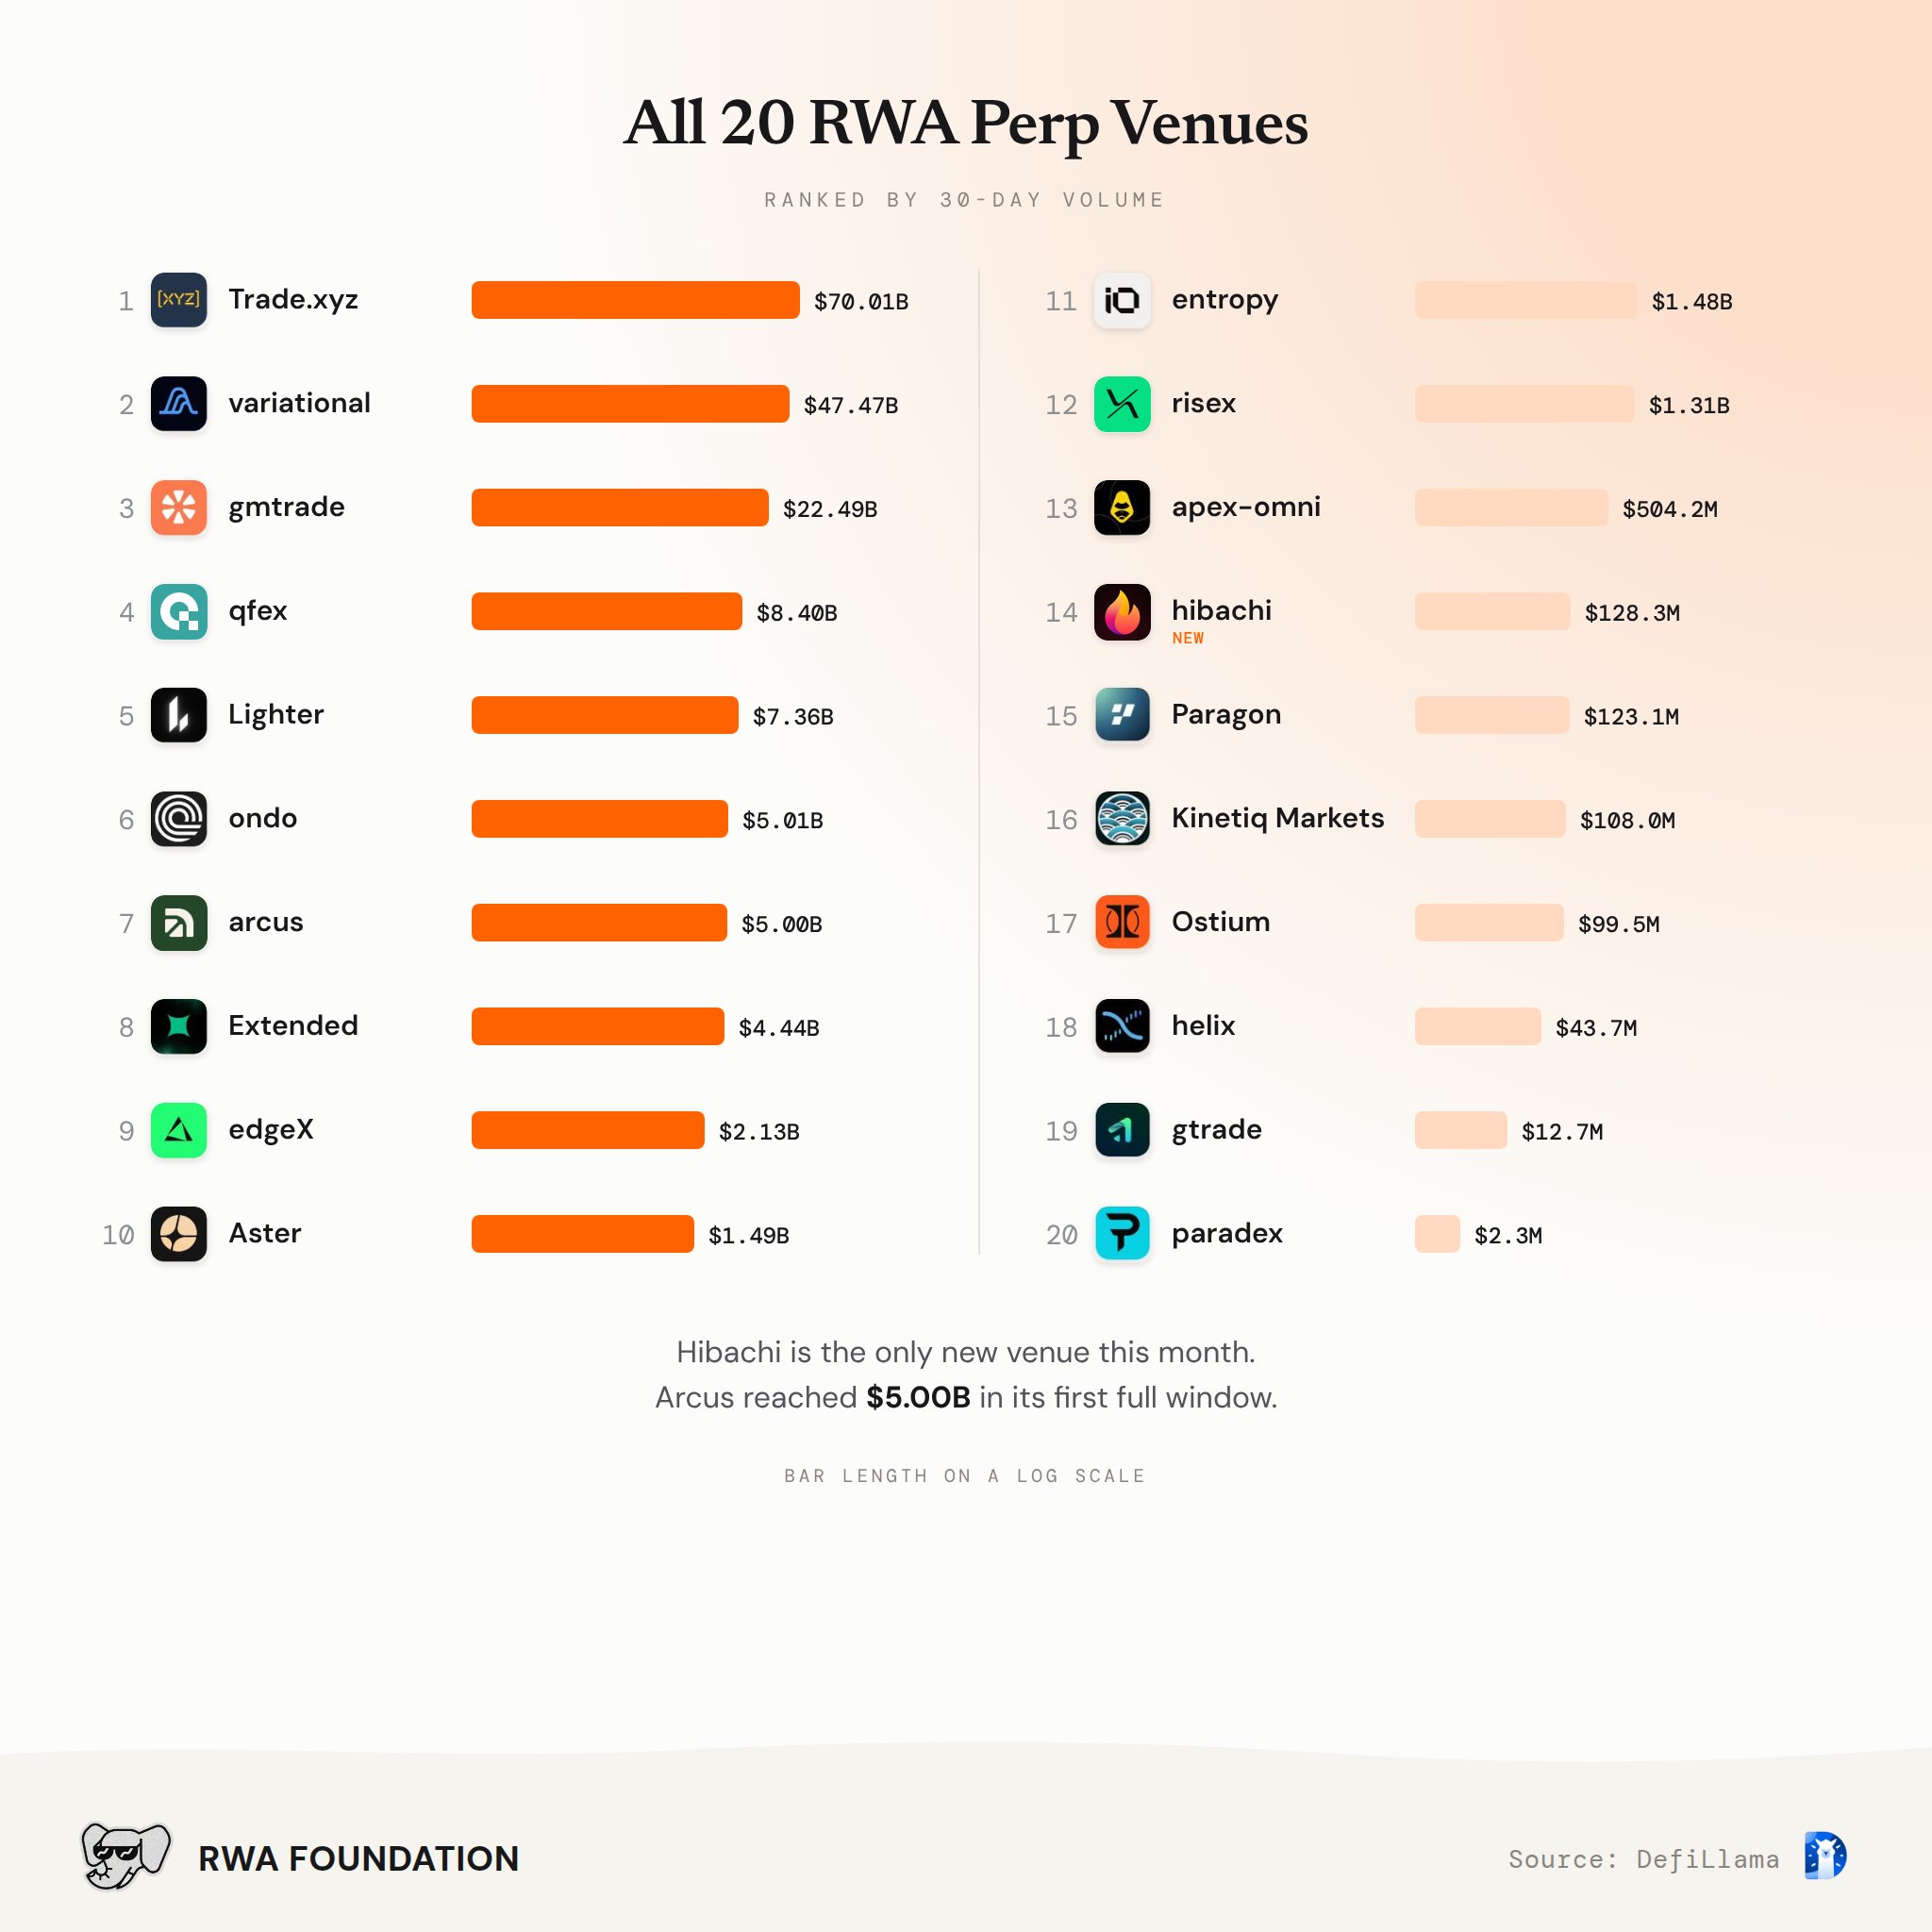
- $47.47B @Variational_io, up 76.6%. Led on four days, up from two in September
- $22.49B @gmtrade_xyz, up 63.4%. Top venue on October 6, its first day in the lead since May
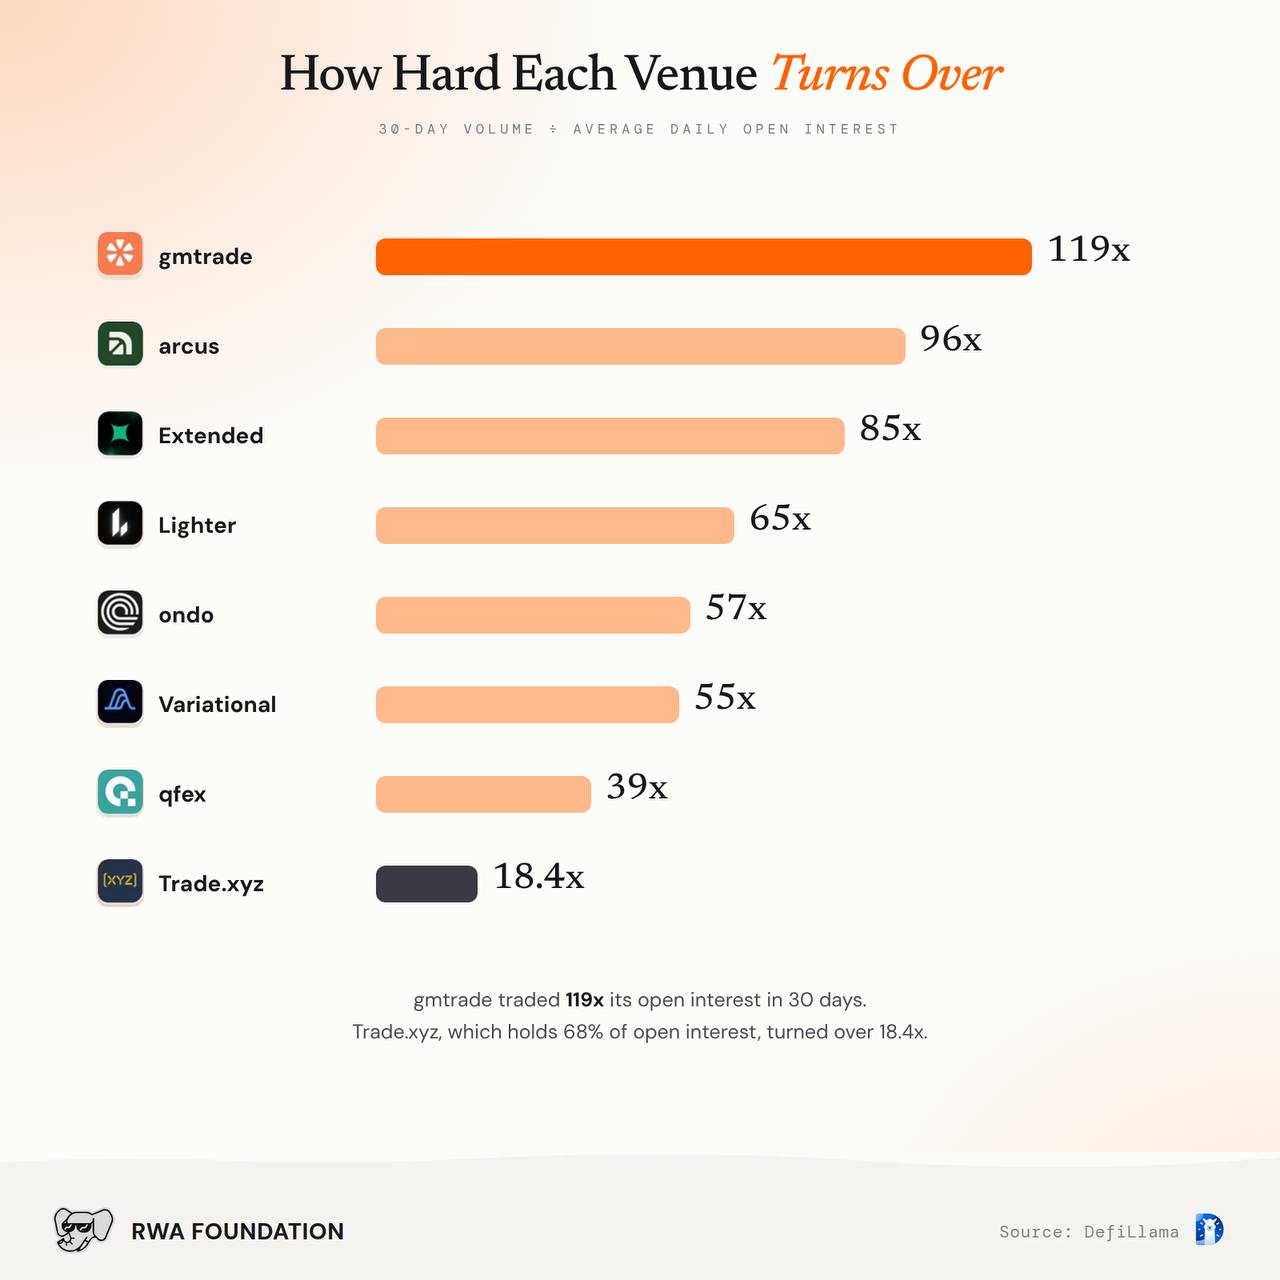
- 119x gmtrade's 30-day volume relative to its open interest, against 18.4x on Trade.xyz
- 20 Venues tracked. Hibachi joined on October 22, and Arcus reached $5.00B in its first full window
Where Volume Moved
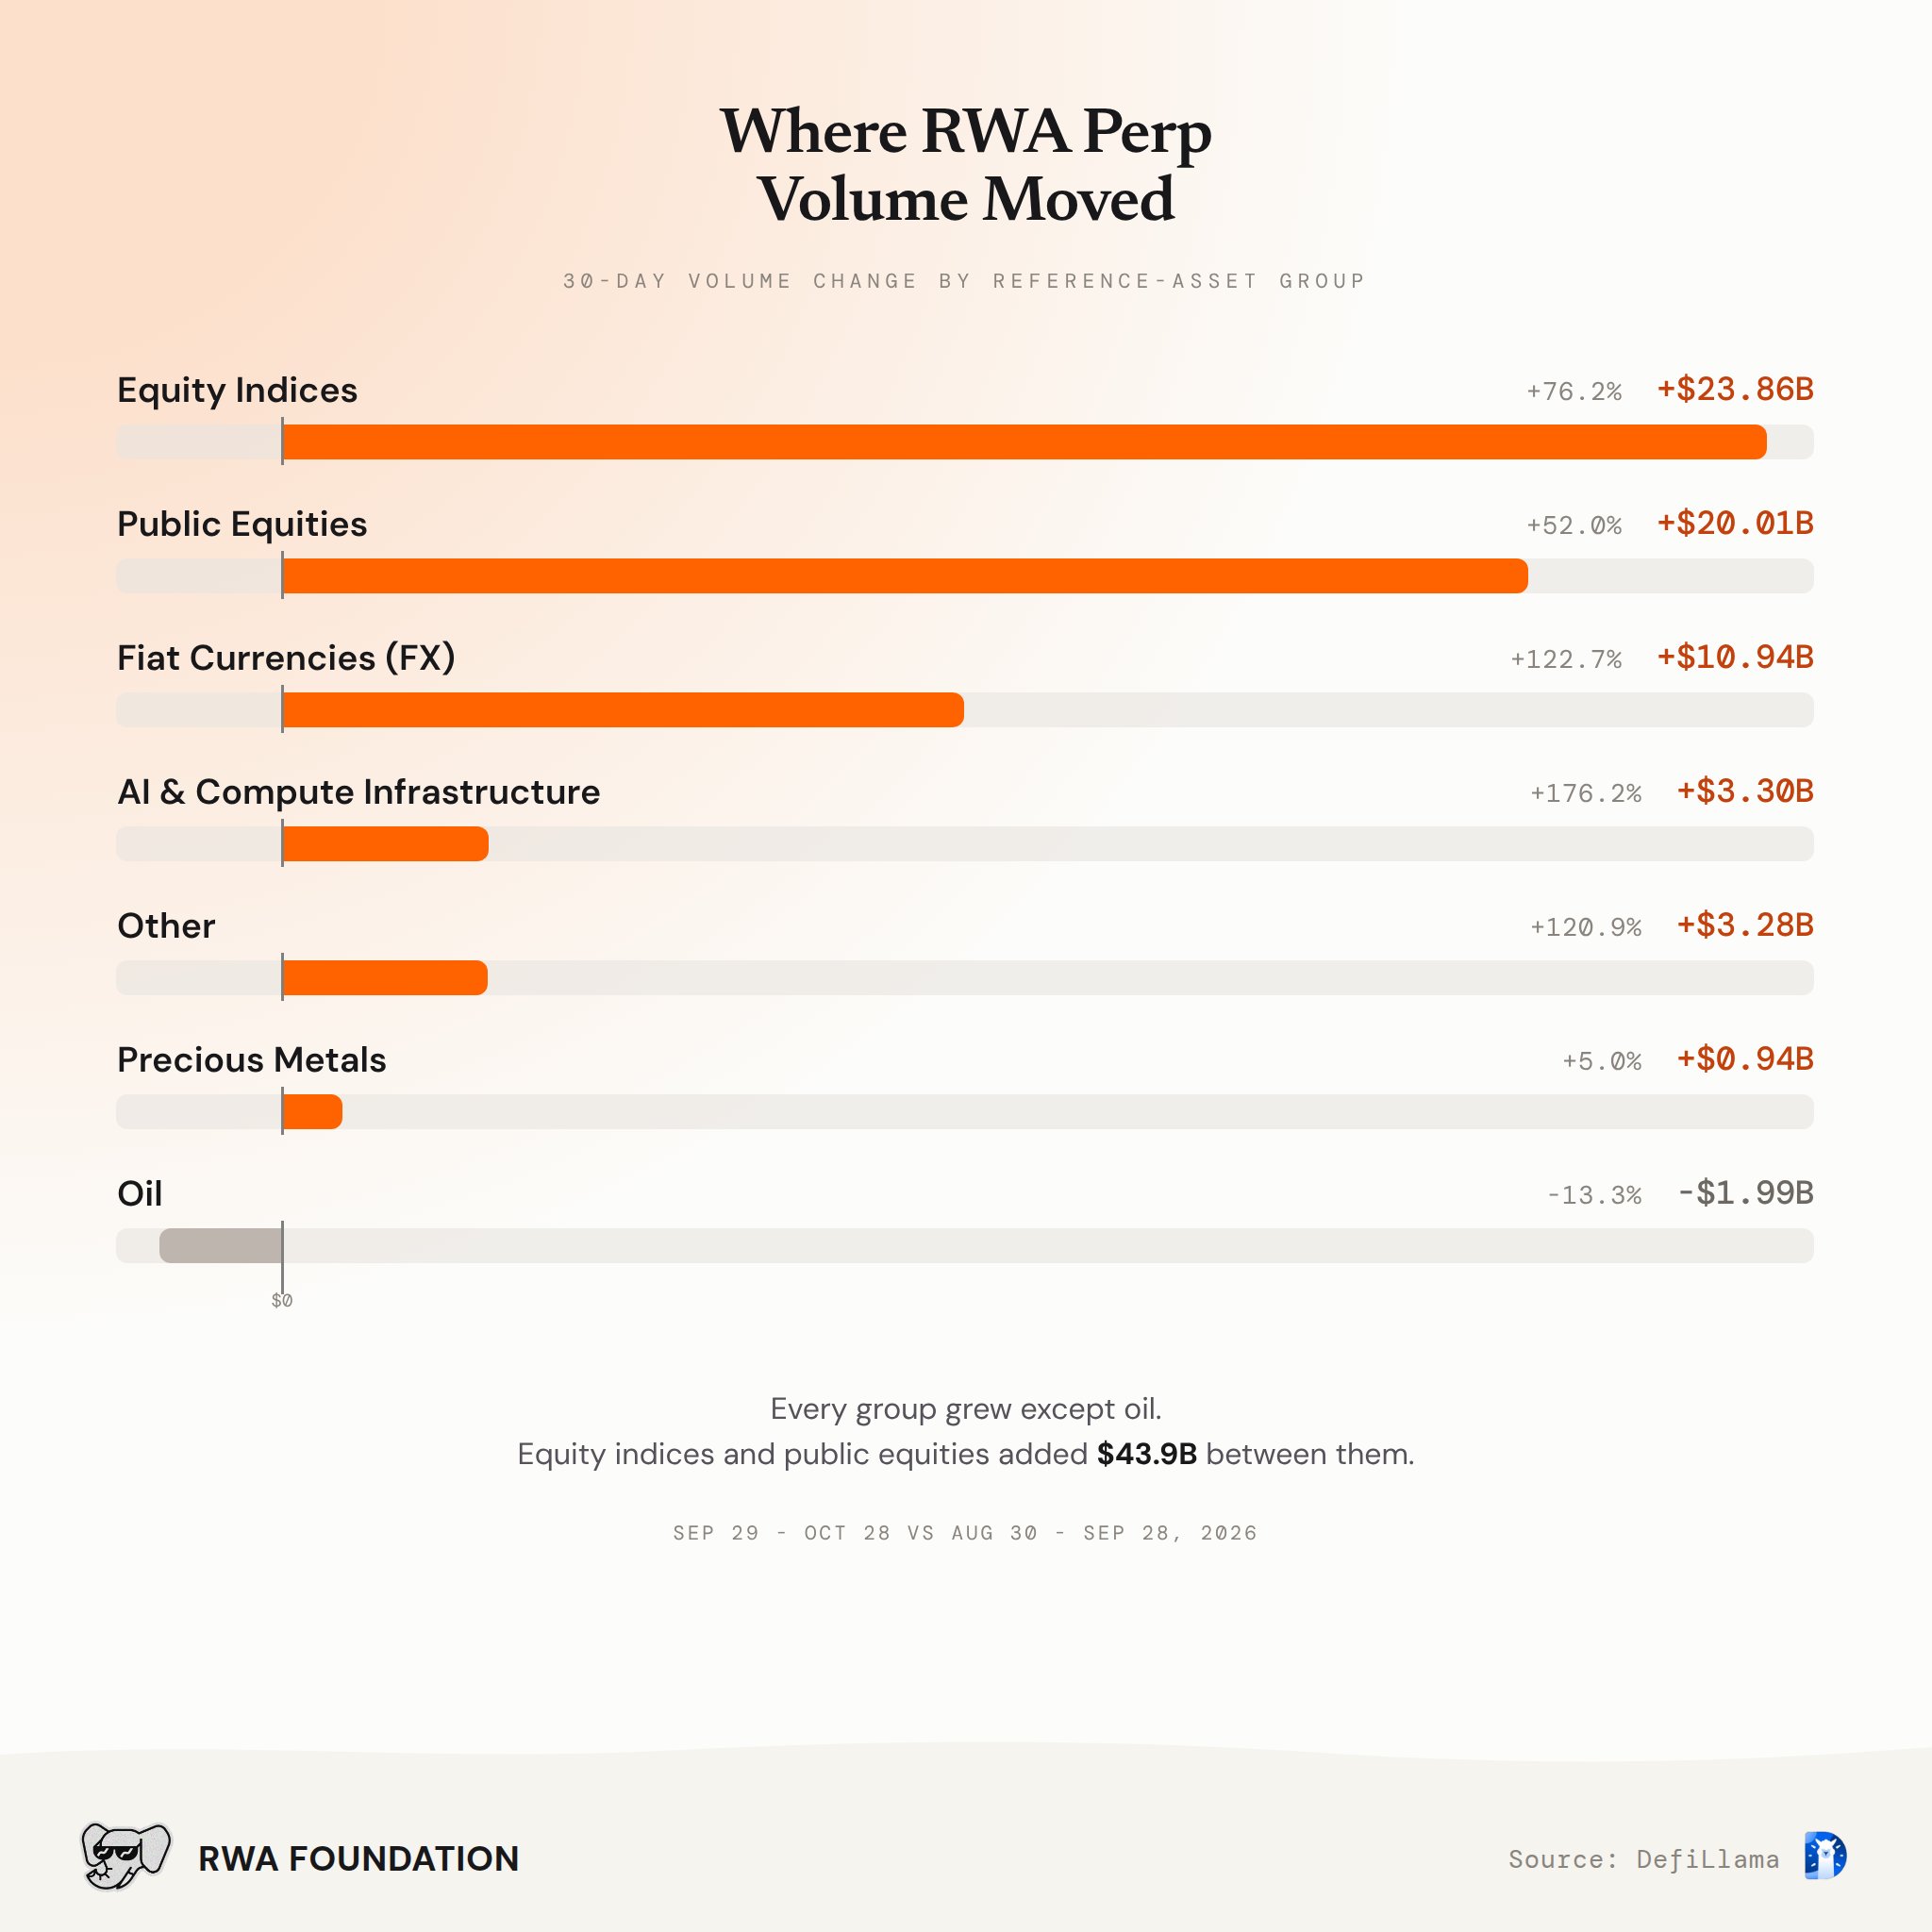
Every reference-asset group grew except oil.
- +$23.86B Equity Indices, up 76.2%. $16.92B came from Variational's Nasdaq-100 and S&P 500 markets
- +$20.01B Public Equities, up 52.0%, after losing $32.8B in September
- +$10.94B Fiat Currencies, up 122.7%, led by gmtrade's USD/CHF and USD/CAD
- -$1.99B Oil, down 13.3%, mostly from Trade.xyz's WTI market
What Traded
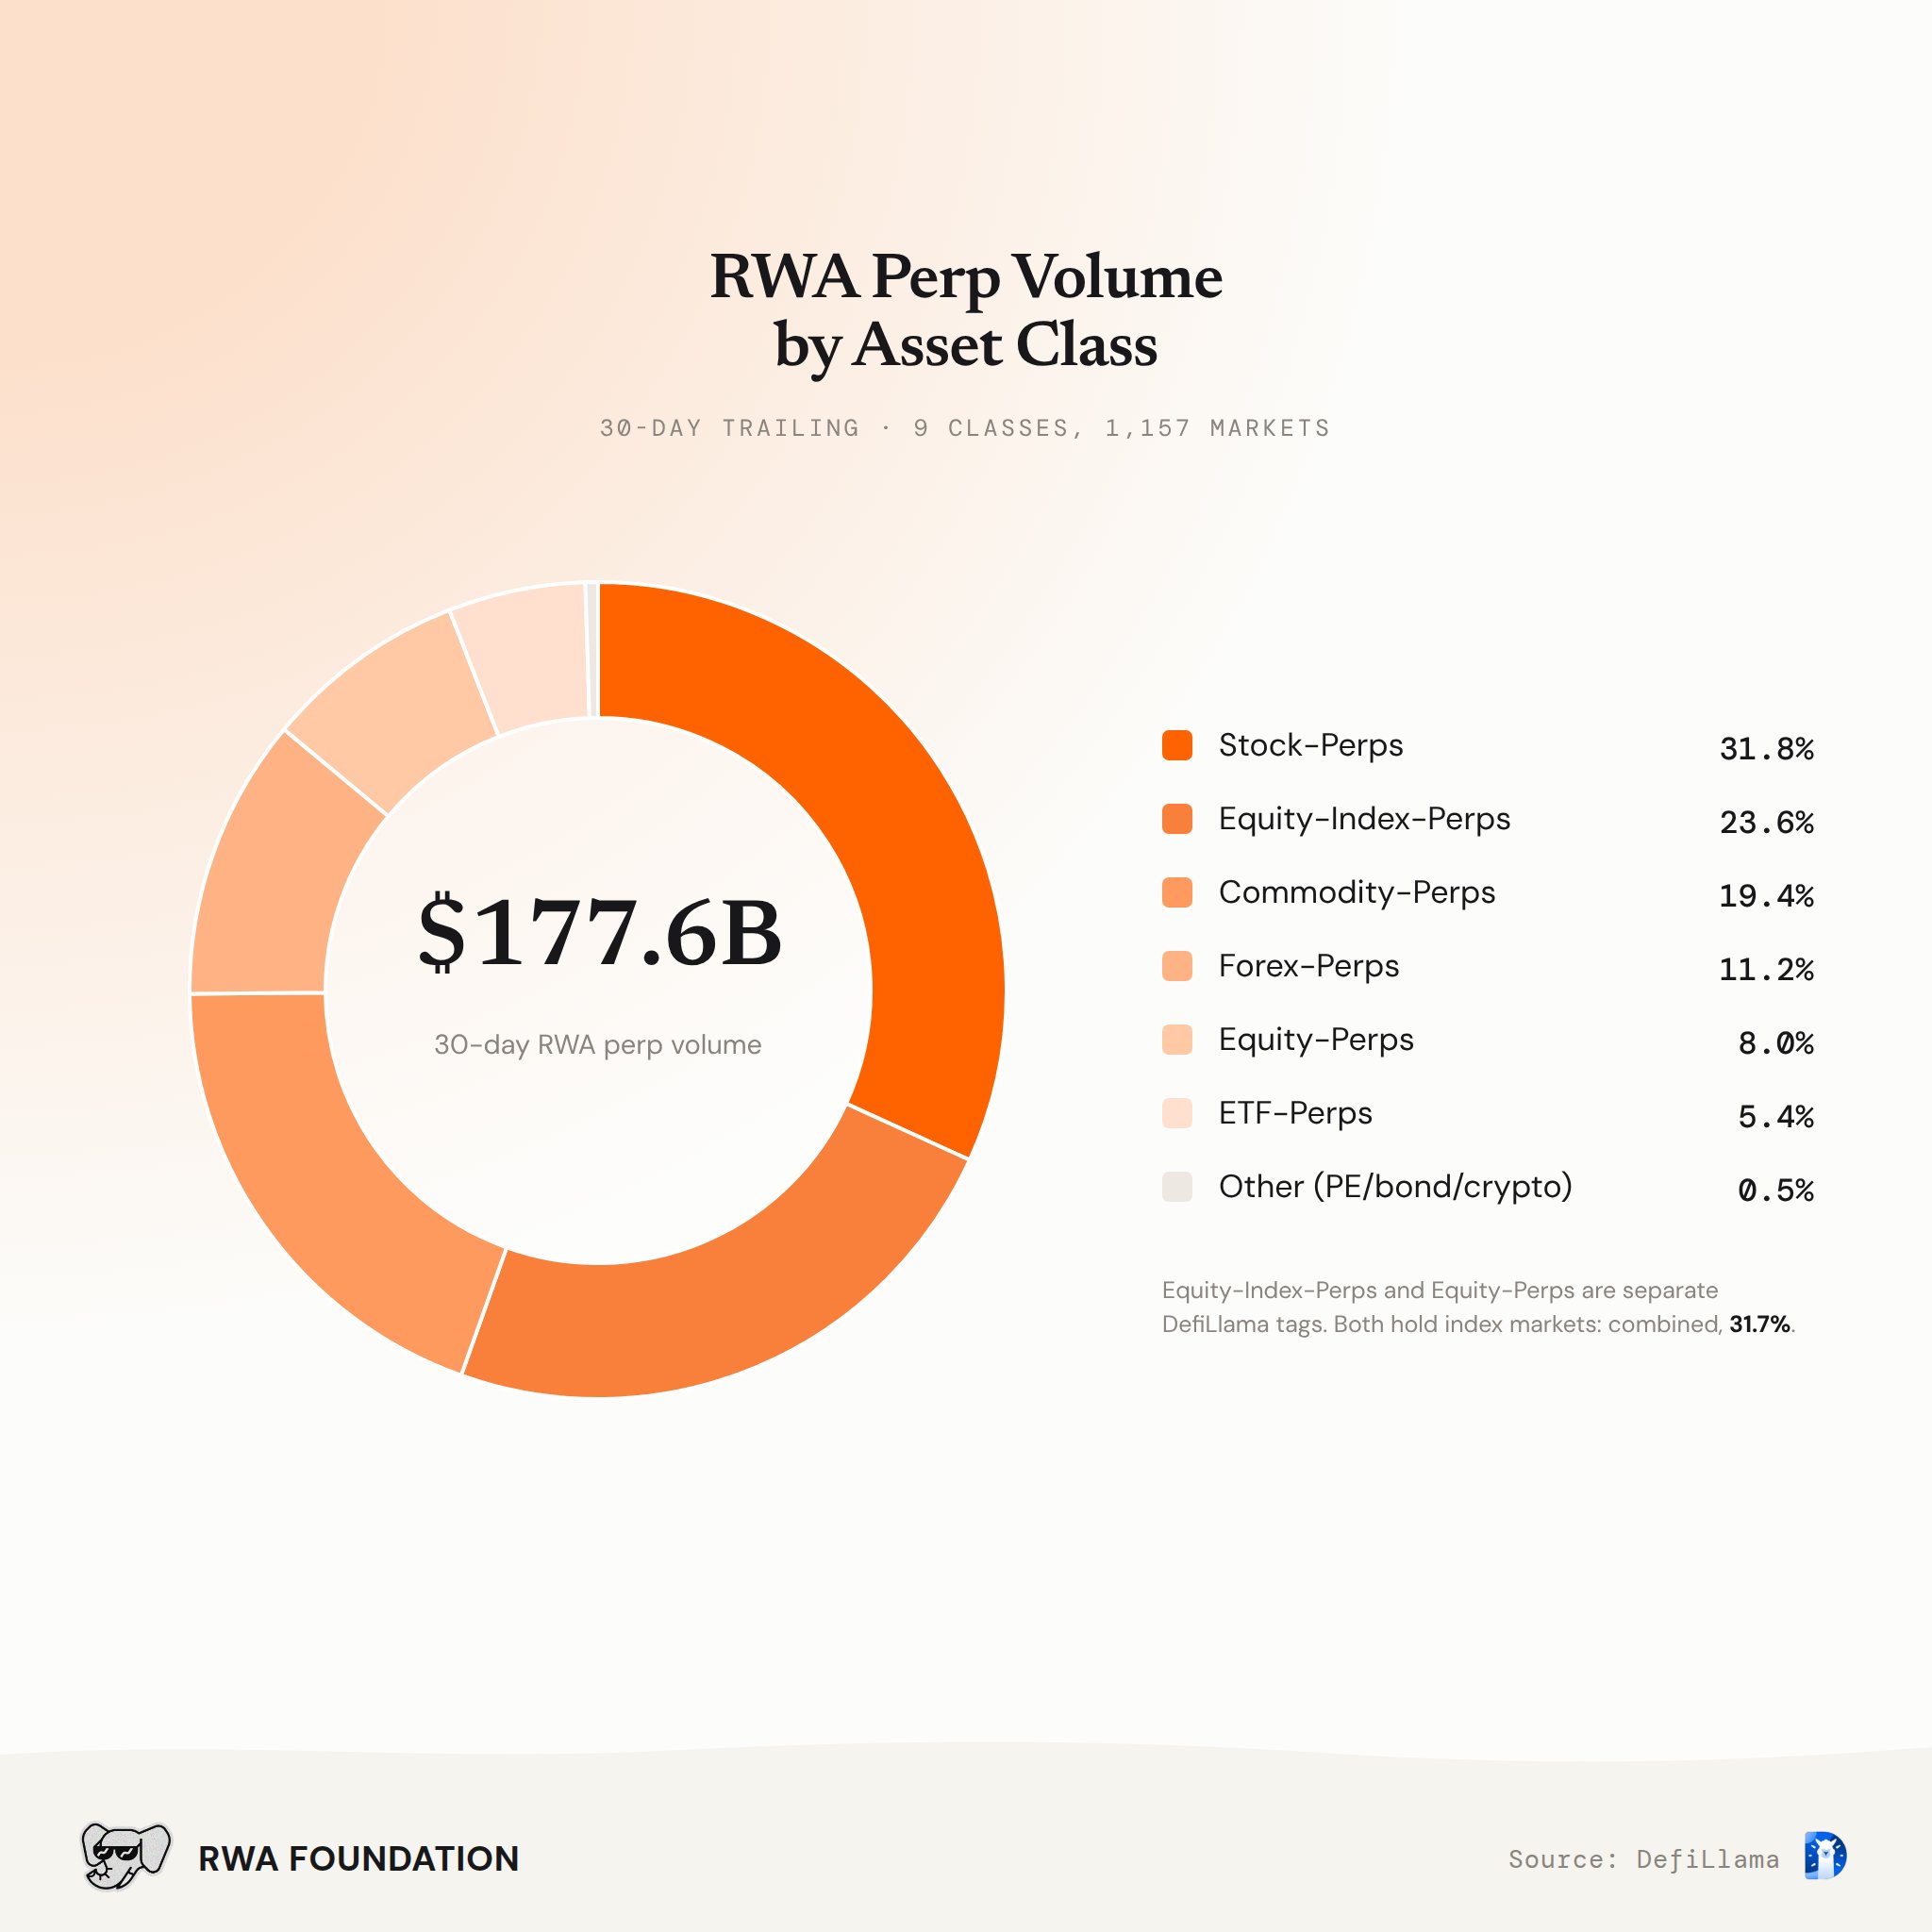
- $56.50B Stock-perps, the largest asset class at 31.8% of volume, up 46.8%
- $41.96B Equity-index-perps, more than doubled and now second
- $34.50B Commodity-perps, flat on September
- 31.7% Index products across DefiLlama's two index tags ($56.23B), up 83.9%
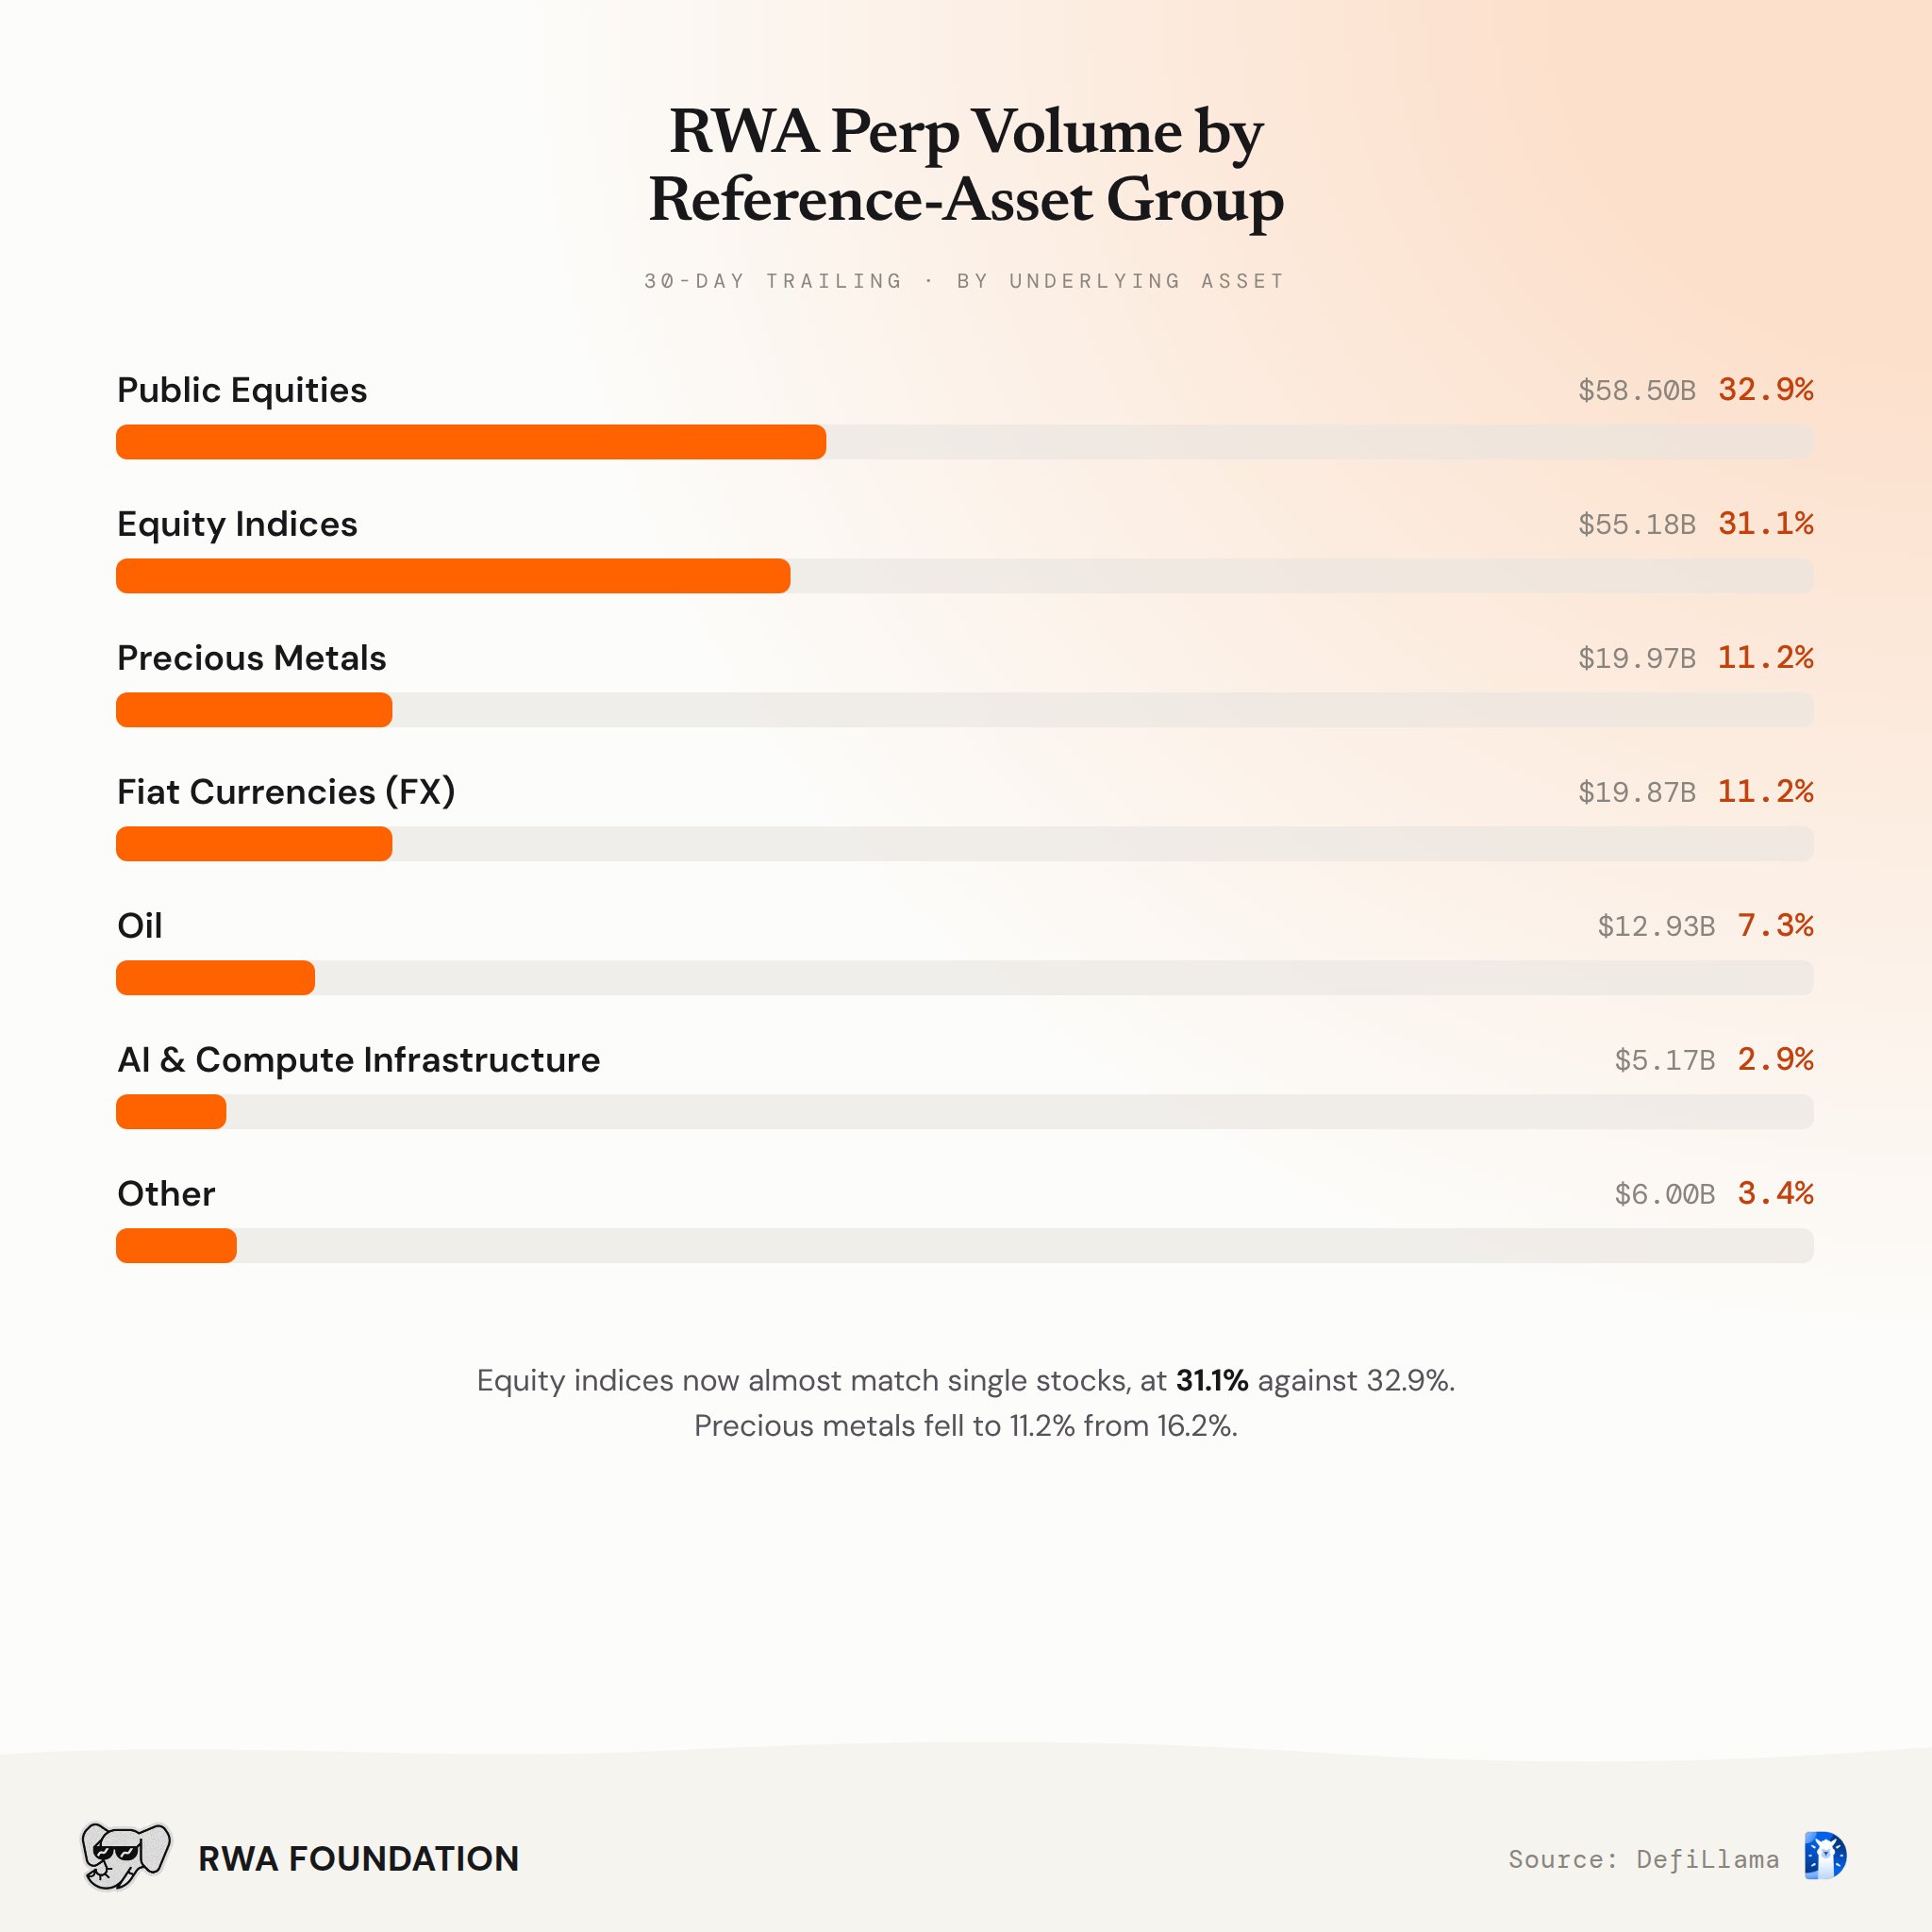
- 32.9% · 31.1% Public Equities and Equity Indices, now almost level by reference asset
- 11.2% Precious Metals' share, down from 16.2%. Fiat Currencies are level with it at 11.2%
Top Markets
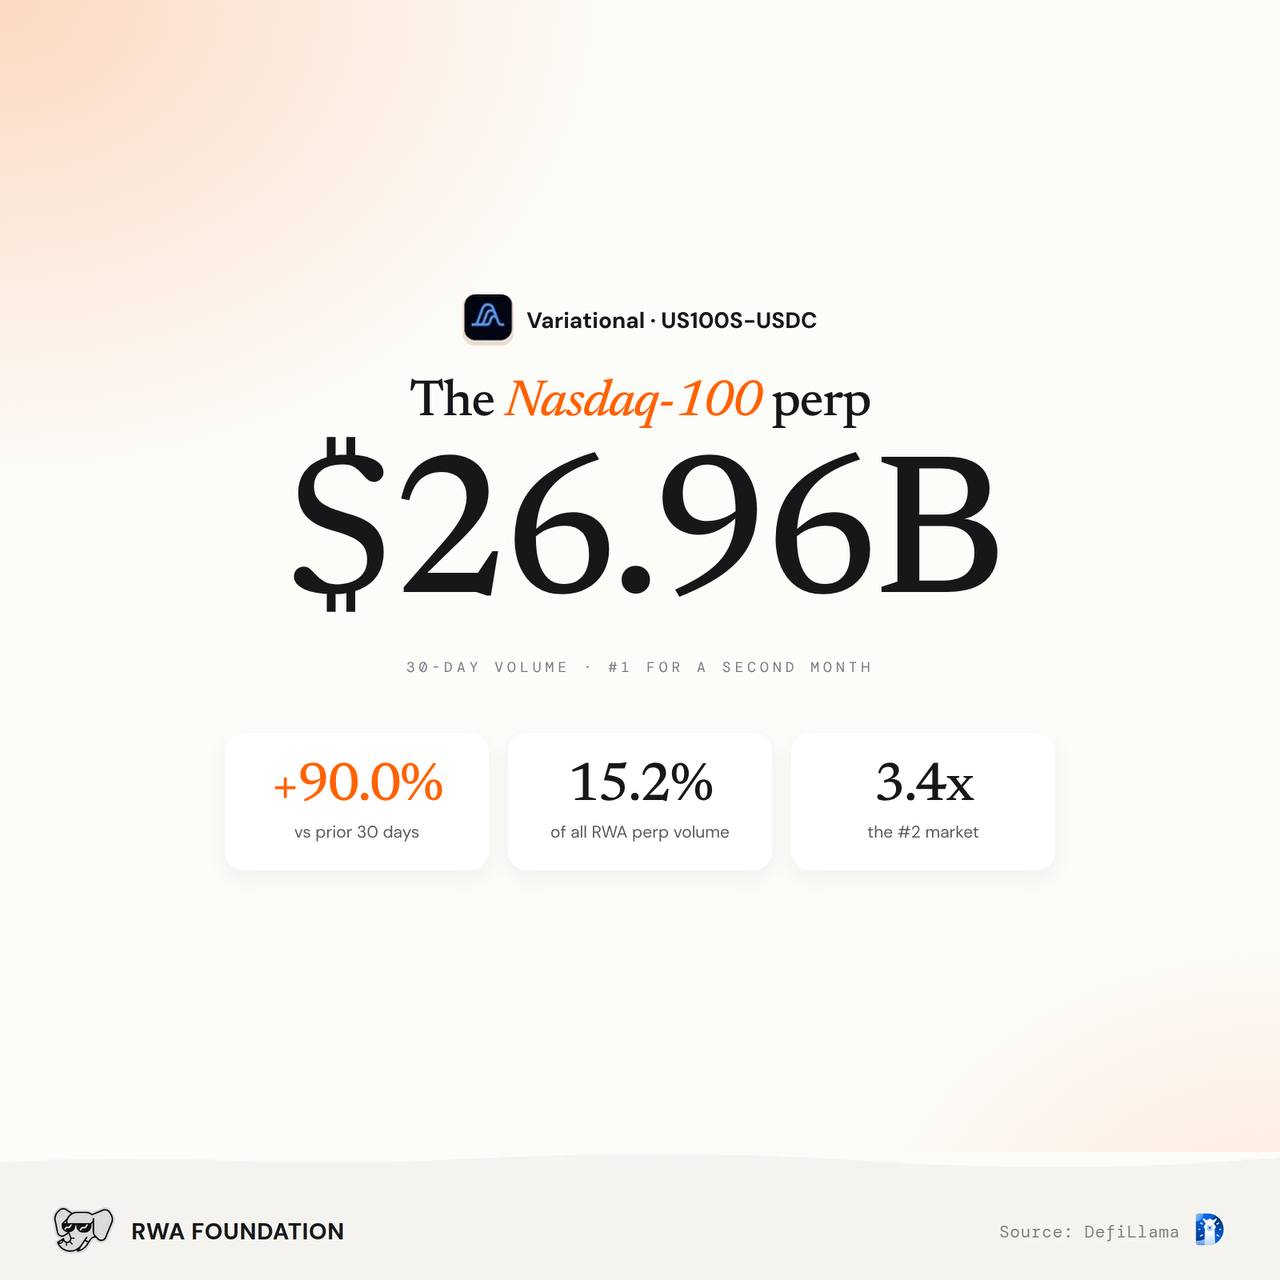
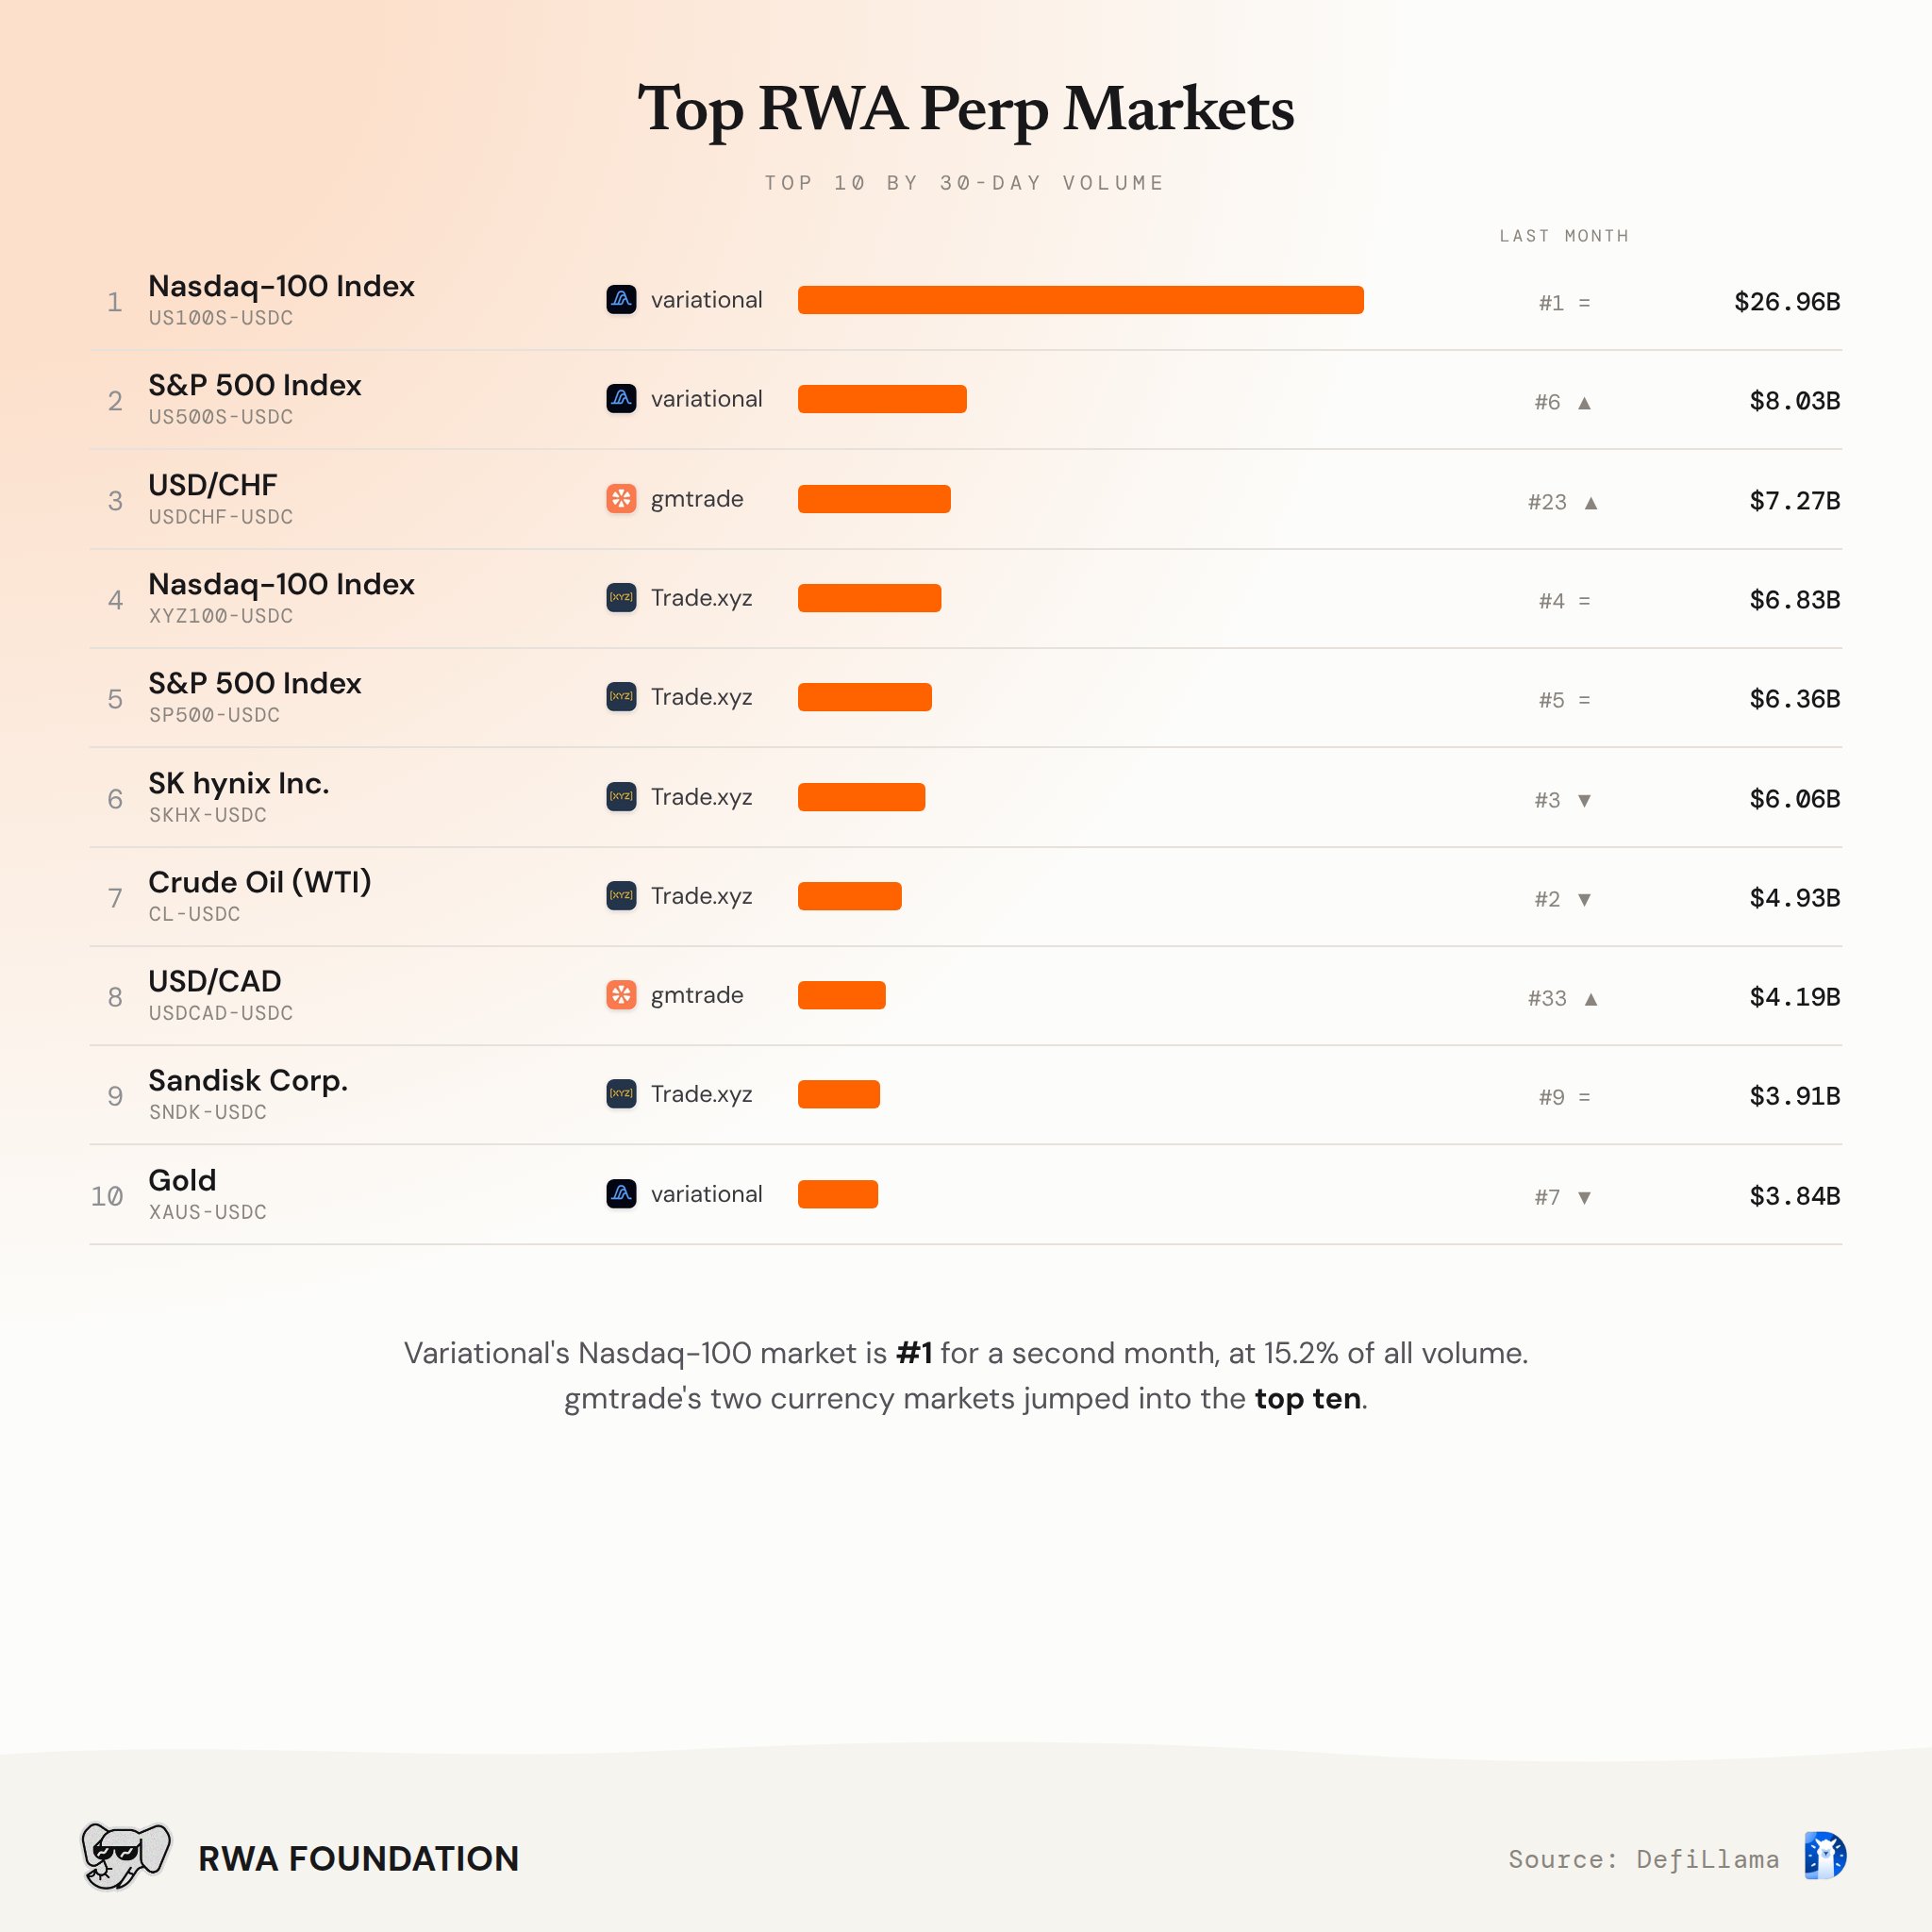
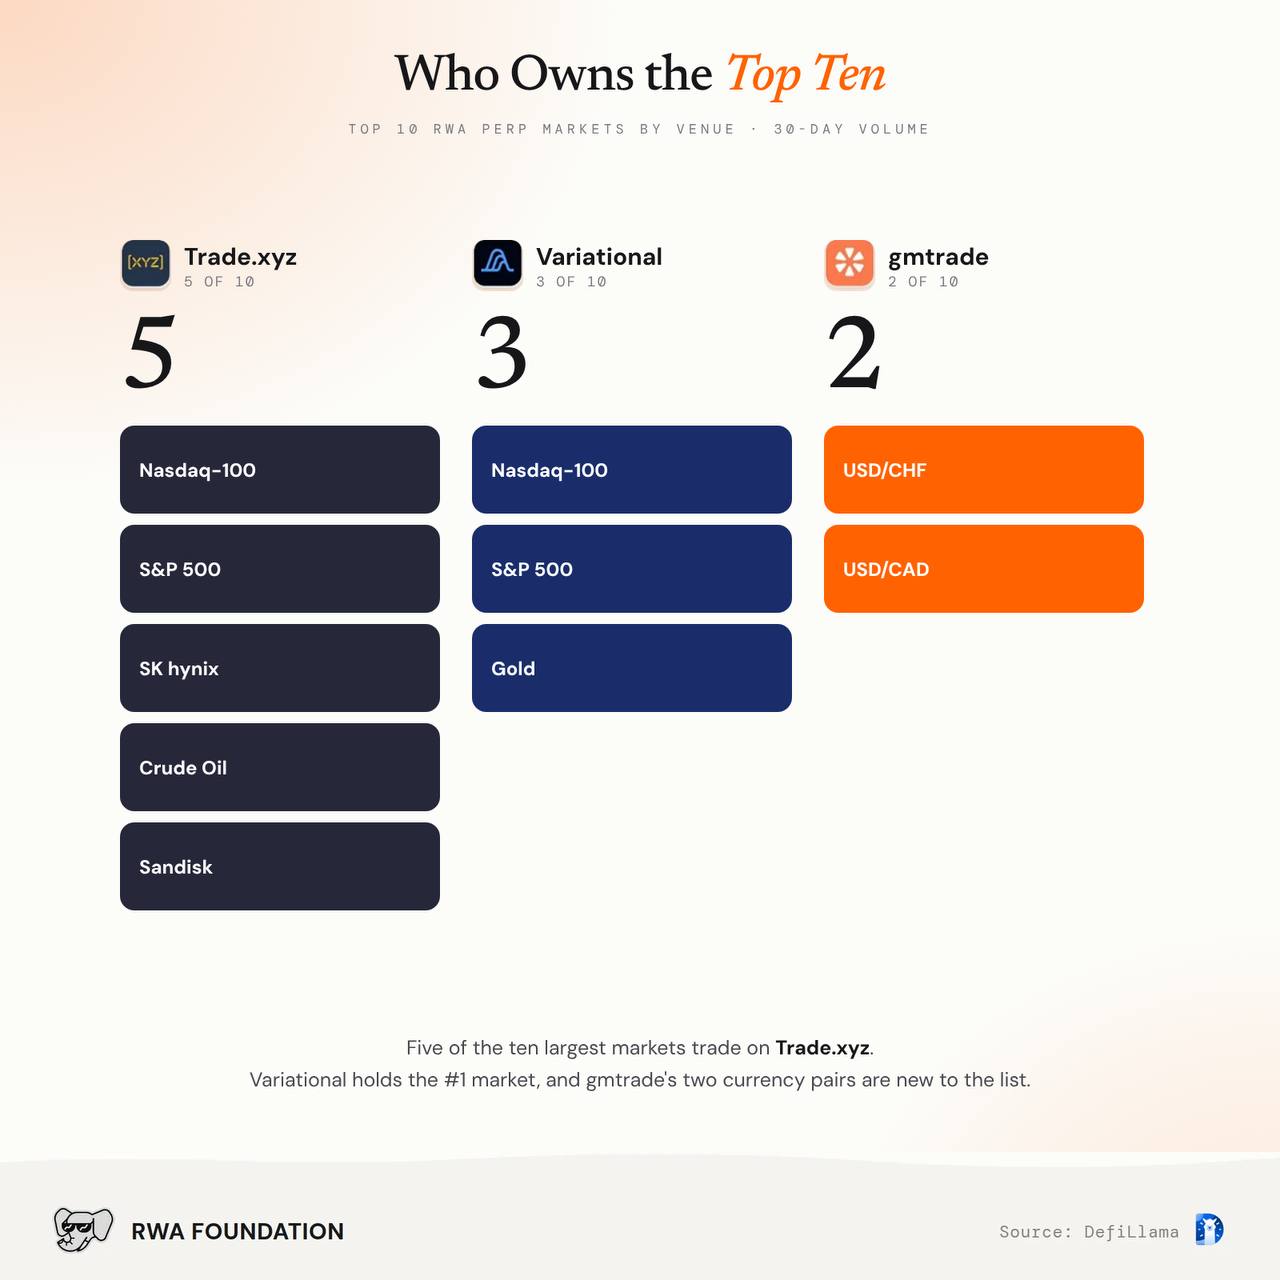
- $26.96B Variational's Nasdaq-100 perp, #1 for a second month and 15.2% of all volume
- 3.4x Its lead over the #2 market, Variational's S&P 500 ($8.03B)
- 23rd → 3rd gmtrade's USD/CHF ($7.27B). USD/CAD rose from 33rd to 8th ($4.19B)
- 2nd → 7th Trade.xyz's WTI crude market, down 28.5%
- 5 · 3 · 2 Top-ten markets on Trade.xyz, Variational and gmtrade
What to Watch
Variational's index markets roughly doubled their volume in their second month, so September's listings held up beyond launch. Positions are the open question. Open interest rose 8.2% against 51.5% for volume, and Trade.xyz still holds more than two-thirds of it. Next month will show whether the turnover on Variational and gmtrade turns into larger, longer-held positions.
Methodology
Windows. Current figures cover September 29 to October 28, 2026, compared against August 30 to September 28, recalculated on the same basis. The prior total of $117.25B differs slightly from last month's published $117.31B, and the prior market count of 1,047 from the published 1,086, because DefiLlama records only each market's current active status.
Daily data. Daily figures are DefiLlama's daily records, each a trailing 24-hour reading, and may not line up exactly with UTC calendar days.
Venues. The report covers the 20 venues DefiLlama tracks as active and excludes centralized-exchange markets it has reclassified as inactive.
Markets. Active markets are pair-on-venue markets with volume above zero in the window.
Open interest. Figures are average daily open interest across each window. Turnover is 30-day volume divided by average daily open interest.
Fees. Estimated protocol fees are left out this month pending confirmation of DefiLlama's methodology.
Asset classes. Asset classes and reference-asset groups follow DefiLlama's current tags, applied to both windows. A small number of assets carry different tags on different venues, and we have not reclassified them.
Disclaimer. All data in this report is sourced from DefiLlama's RWA perpetuals dataset via LlamaAI. Figures reflect DefiLlama's own coverage as of the report date, and other providers may track different venues or calculate figures differently. This report is for informational purposes only and does not constitute financial or investment advice.