
Venues, asset classes, and reference-asset groups: a data-driven view of RWA perpetual futures, prepared by RWA Foundation.
DATA AS OF SEPTEMBER 28, 2026, 30-DAY TRAILING FIGURES.
01Overview
This report is published by RWA Foundation using data from DefiLlama's RWA perpetuals dataset. It covers onchain perpetual futures referencing real-world assets, ranked by venue, asset class, reference-asset group and individual market. All figures are 30-day trailing, with month-over-month changes measured against the preceding 30 days.
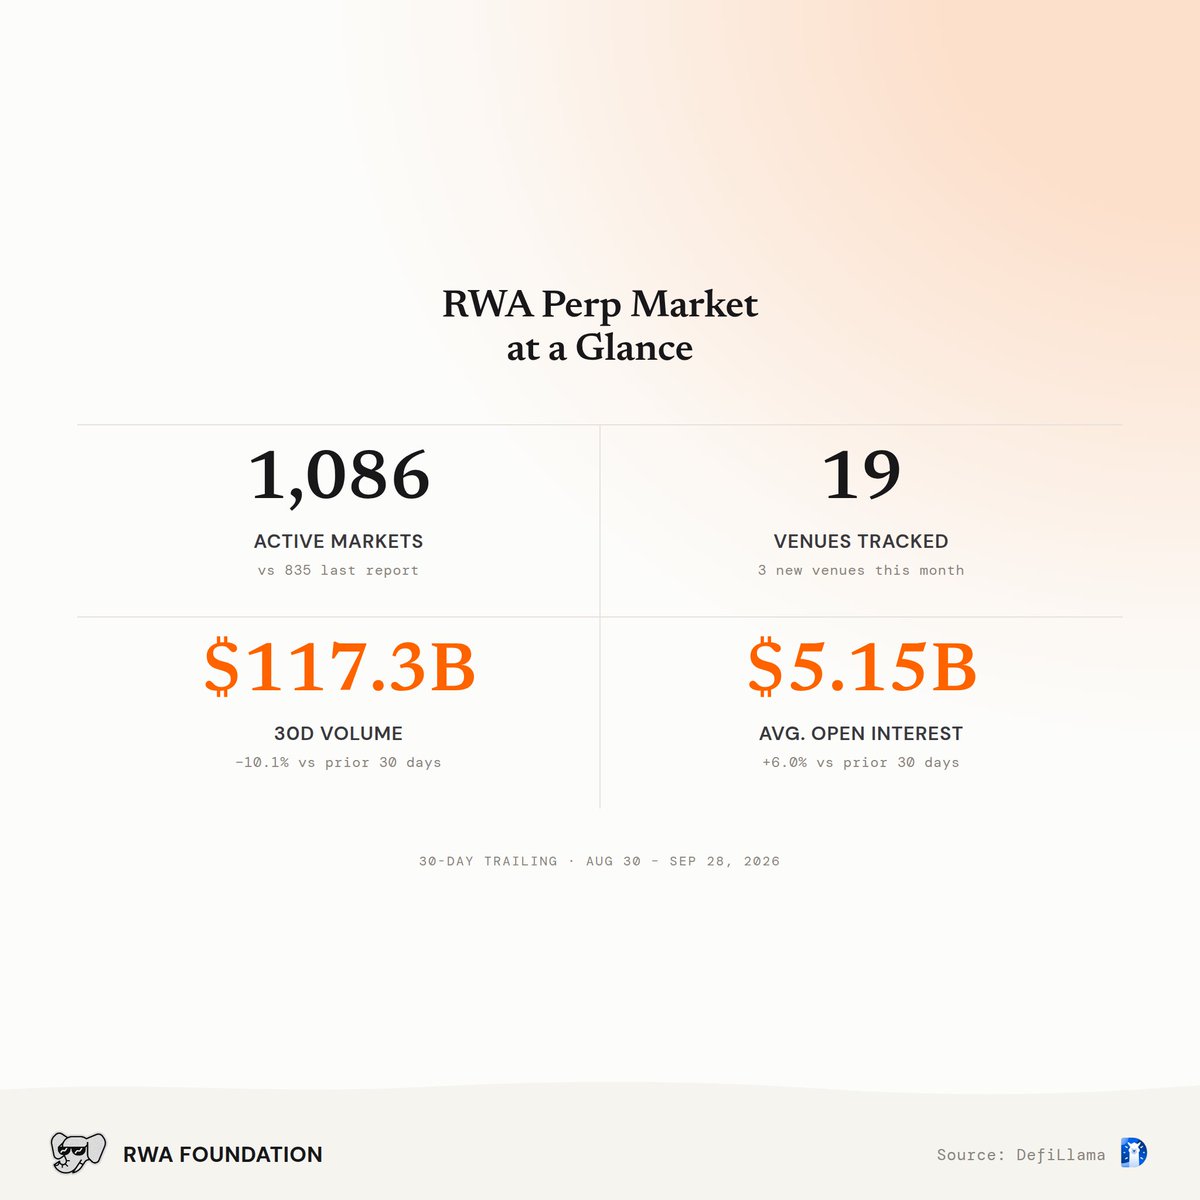
Across DefiLlama's tracked RWA perp dataset, 1,086 active markets across 19 venues generated $117.31B in 30-day volume, down 10.1%, while average daily open interest rose 6.0% to $5.15B. Trade.xyz remains the largest venue, but its share of volume fell from 73.2% to 46.7%, and on September 23rd, Variational out-traded it for the first time.
The decline sits almost entirely in single stocks, as the memory and semiconductor trade that dominated last month unwound. Much of the offsetting growth came from markets listed during the month.
02Venue Landscape
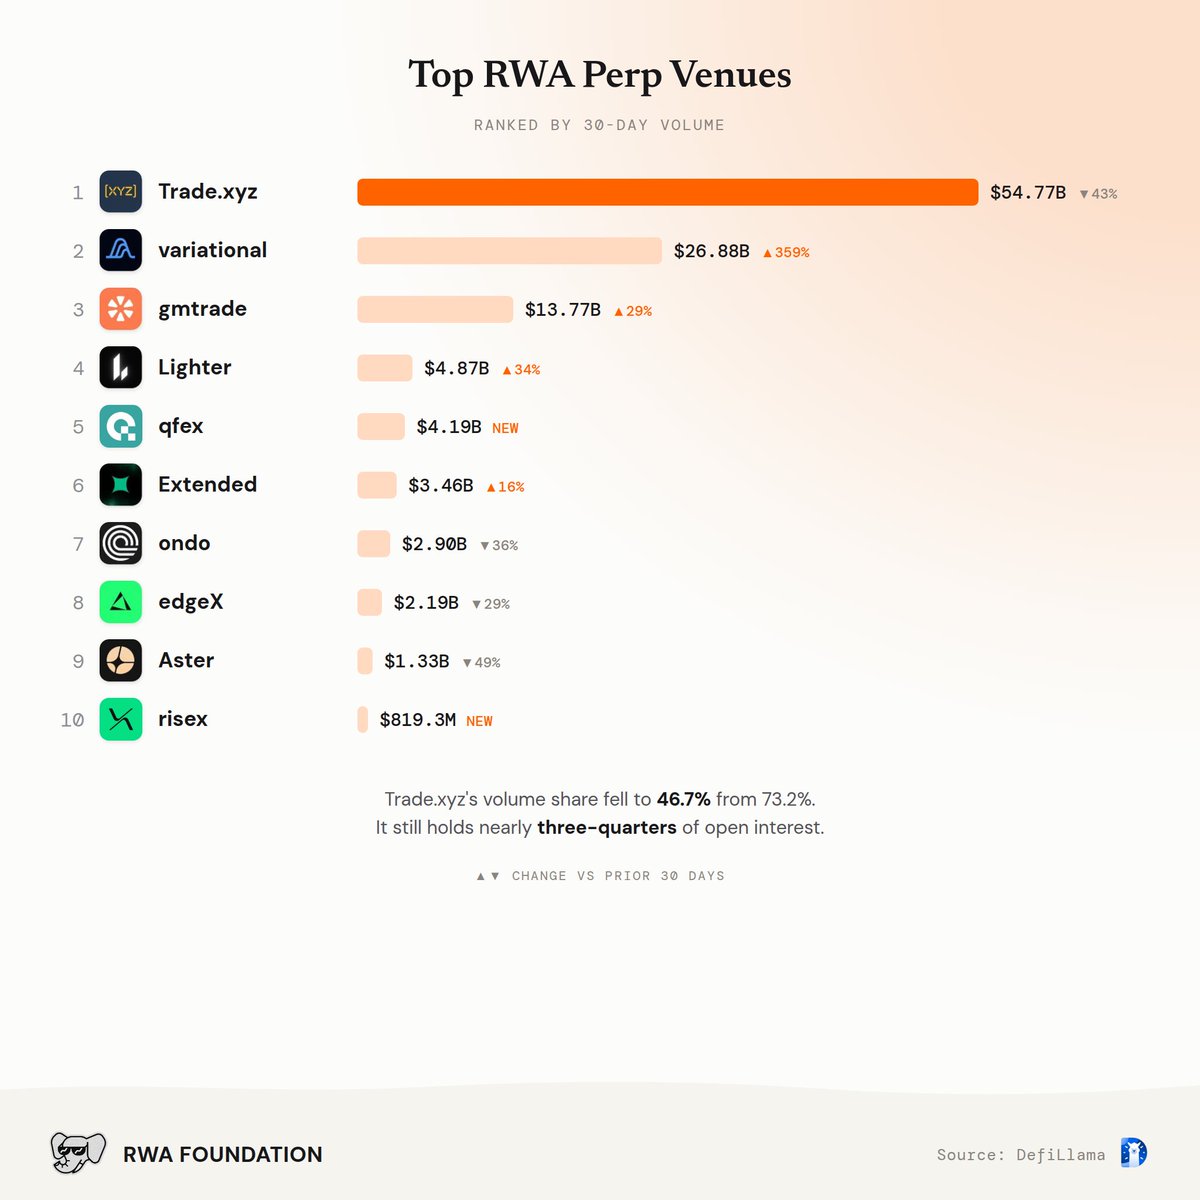
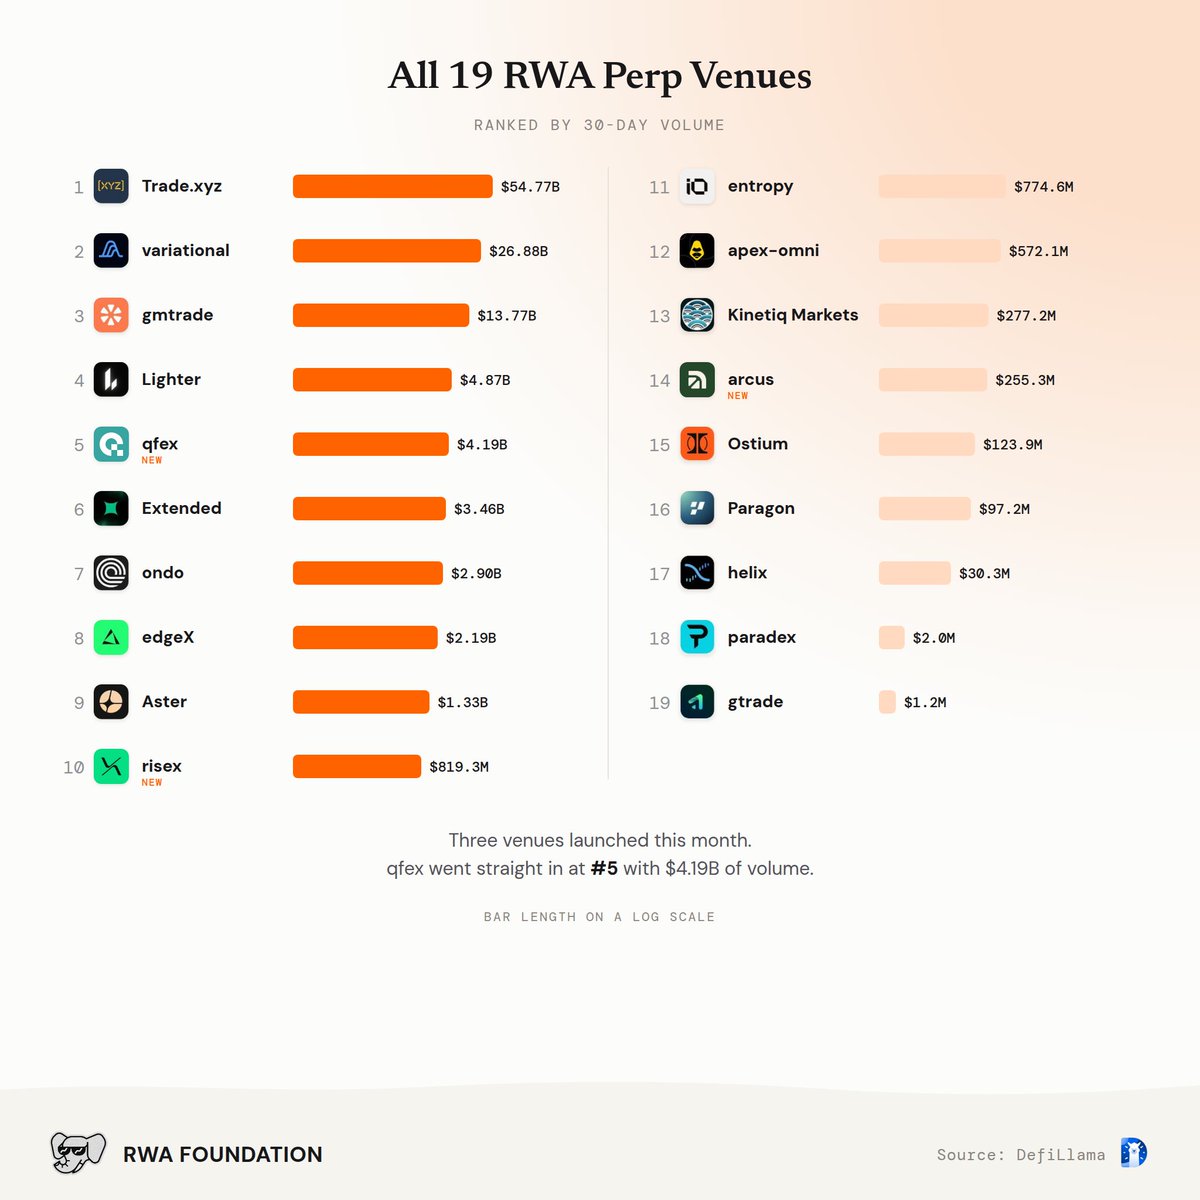
Nineteen venues now carry tracked RWA perp volume, up from sixteen, and the distribution is less top-heavy than a month ago. Trade.xyz, a Hyperliquid HIP-3 deployer, generated $54.77B, down 42.6%, yet still carries roughly 73% of open interest. Seven memory and semiconductor markets account for about two-thirds of its decline.
@Variational_io is now a clear second at $26.88B (22.9%), up from $5.86B, with its newly listed Nasdaq-100 market alone accounting for $14.19B. On September 23 and 24 it out-traded Trade.xyz, the first days it has done so since its history in the dataset begins in May. gmtrade ranks third at $13.77B (11.7%), up 28.9%.
@Variational_io and @gmtrade_xyz also show far higher turnover than the leader, with volume running at 39 and 88 times their open interest, against 14.5 times on Trade.xyz.
03Venue Rankings
04Where Volume Moved
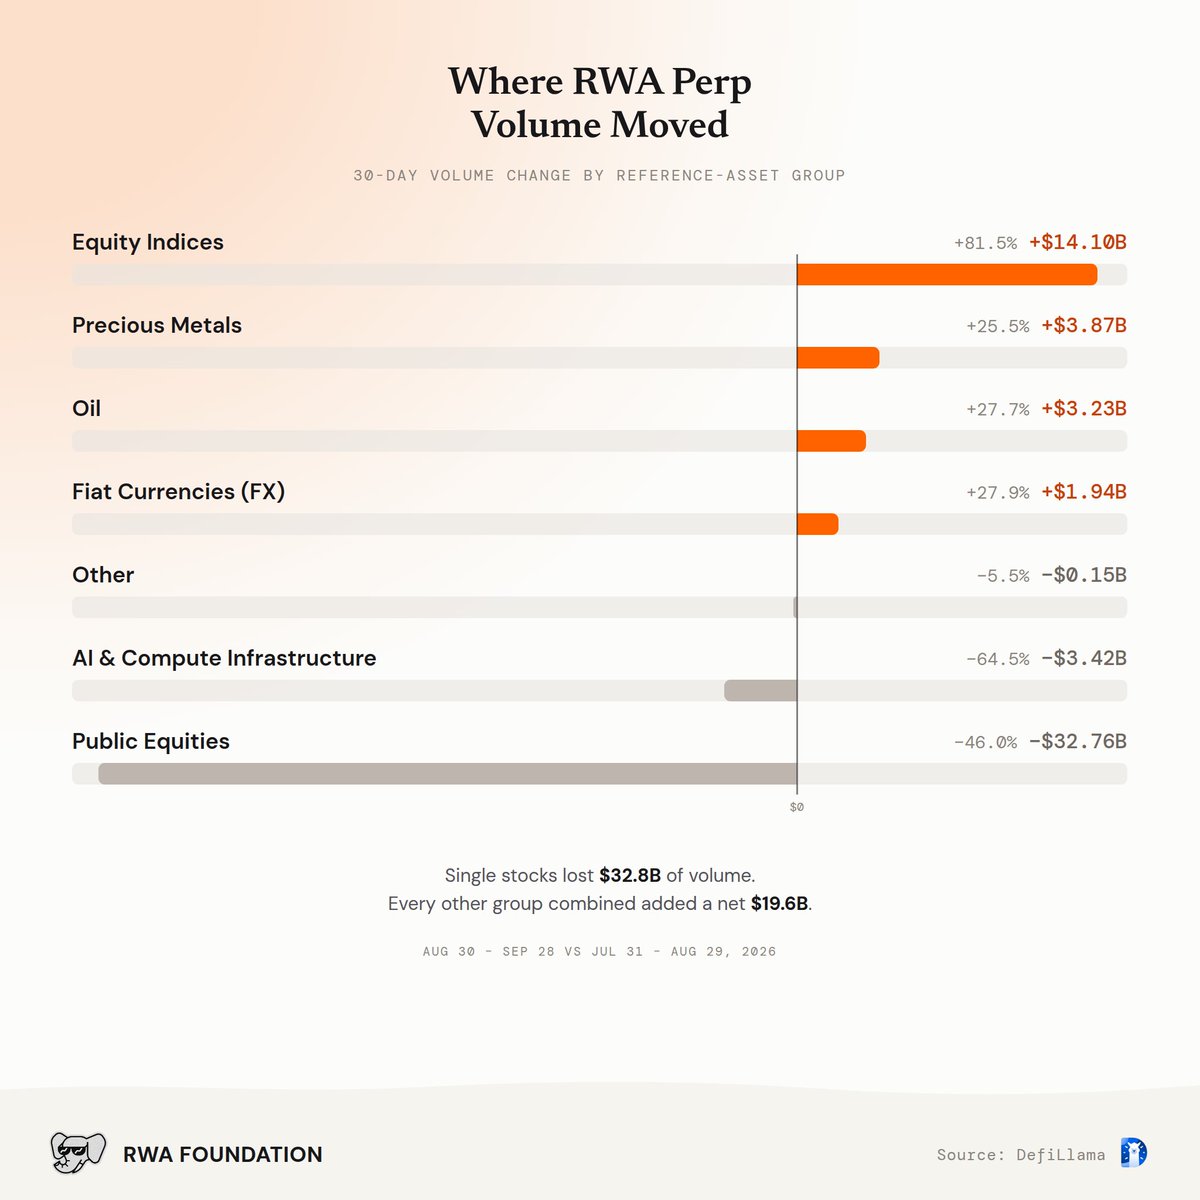
Public equities lost $32.8B of volume over the month, while every other reference-asset group combined added a net $19.6B, most of it from newly listed markets.
Equity Indices gained $14.1B (81.5%), but Variational's new Nasdaq-100 and S&P 500 markets generated $18.1B between them. Precious Metals rose $3.9B on a similar pattern, driven by Variational's new gold and silver contracts. Oil, up $3.2B (27.7%), is the one group where growth was broad-based. AI & Compute Infrastructure, which last month pointed to an emerging niche, fell 64.5% to $1.88B.
Open interest offers a steadier read. It rose 12.8% in precious metals and 11.3% in oil, while equity indices saw a burst of trading with open interest down 2.6%.
05Asset Class Mix
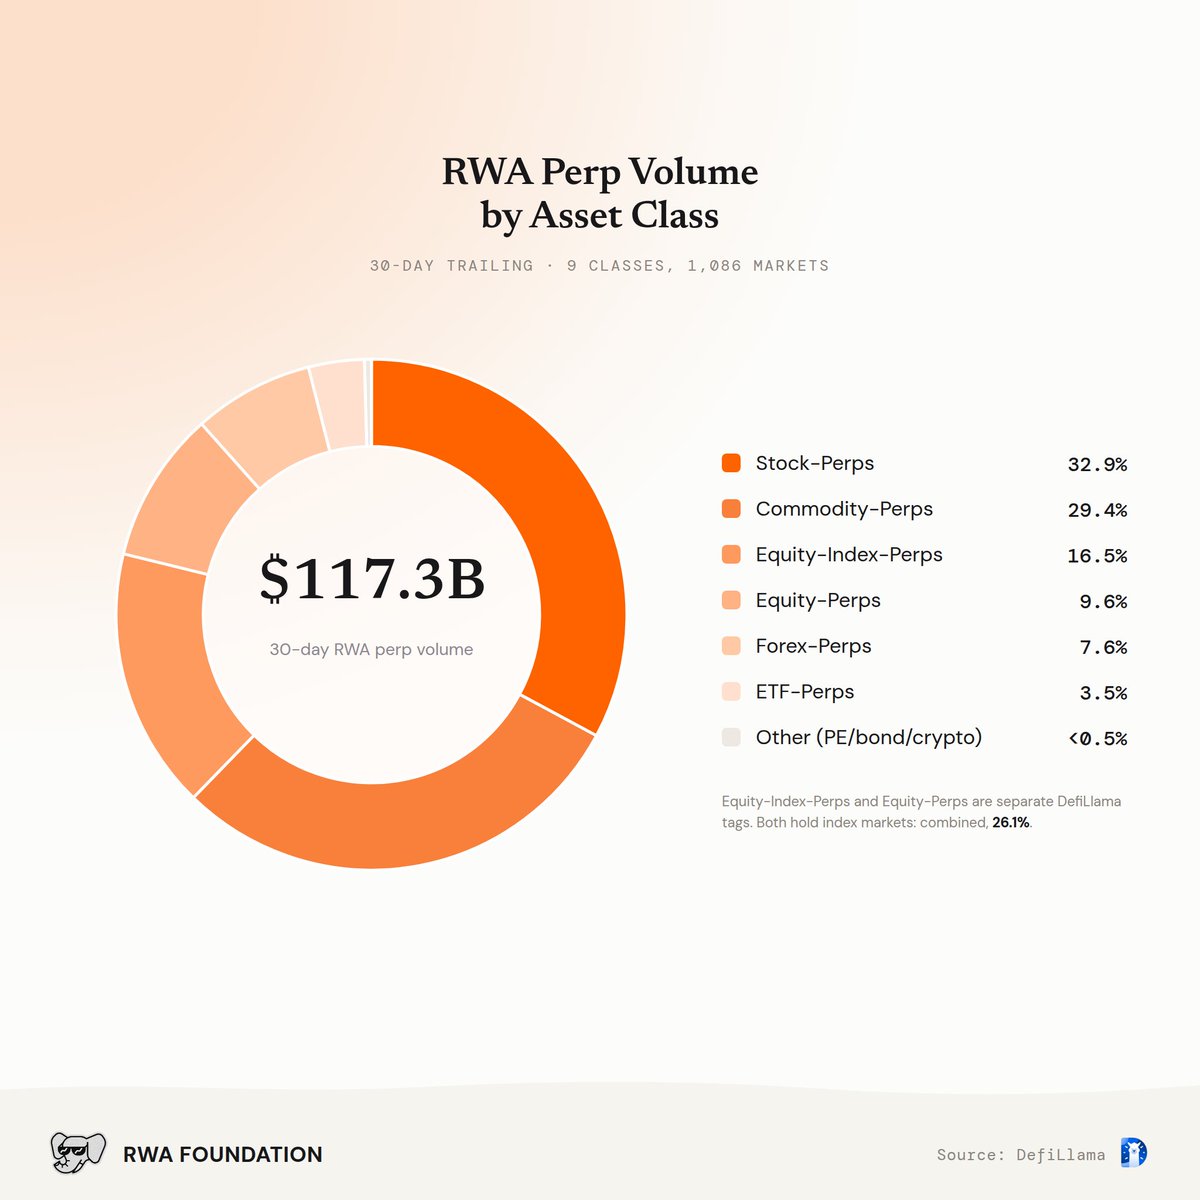
Stock-perps remain the largest asset class at $38.54B (32.9% share), down from 54.6%, with commodity-perps a close second at $34.52B (29.4%), up 25.0%. Stock-perp listings grew to 790 markets, yet average volume per stock market fell from $133.4M to $50.4M.
Index products sit under two DefiLlama tags, equity-index-perp and equity-perp, split by how each venue's markets were recorded rather than by product. Together they generated $30.67B (26.1%), up 85%. Forex-perps grew 27.9% to $8.92B, while etf-perps fell 47.3% to $4.14B. Private-equity, bond and crypto-index perps remain nascent at 0.4% of volume.
06Reference-Asset Groups
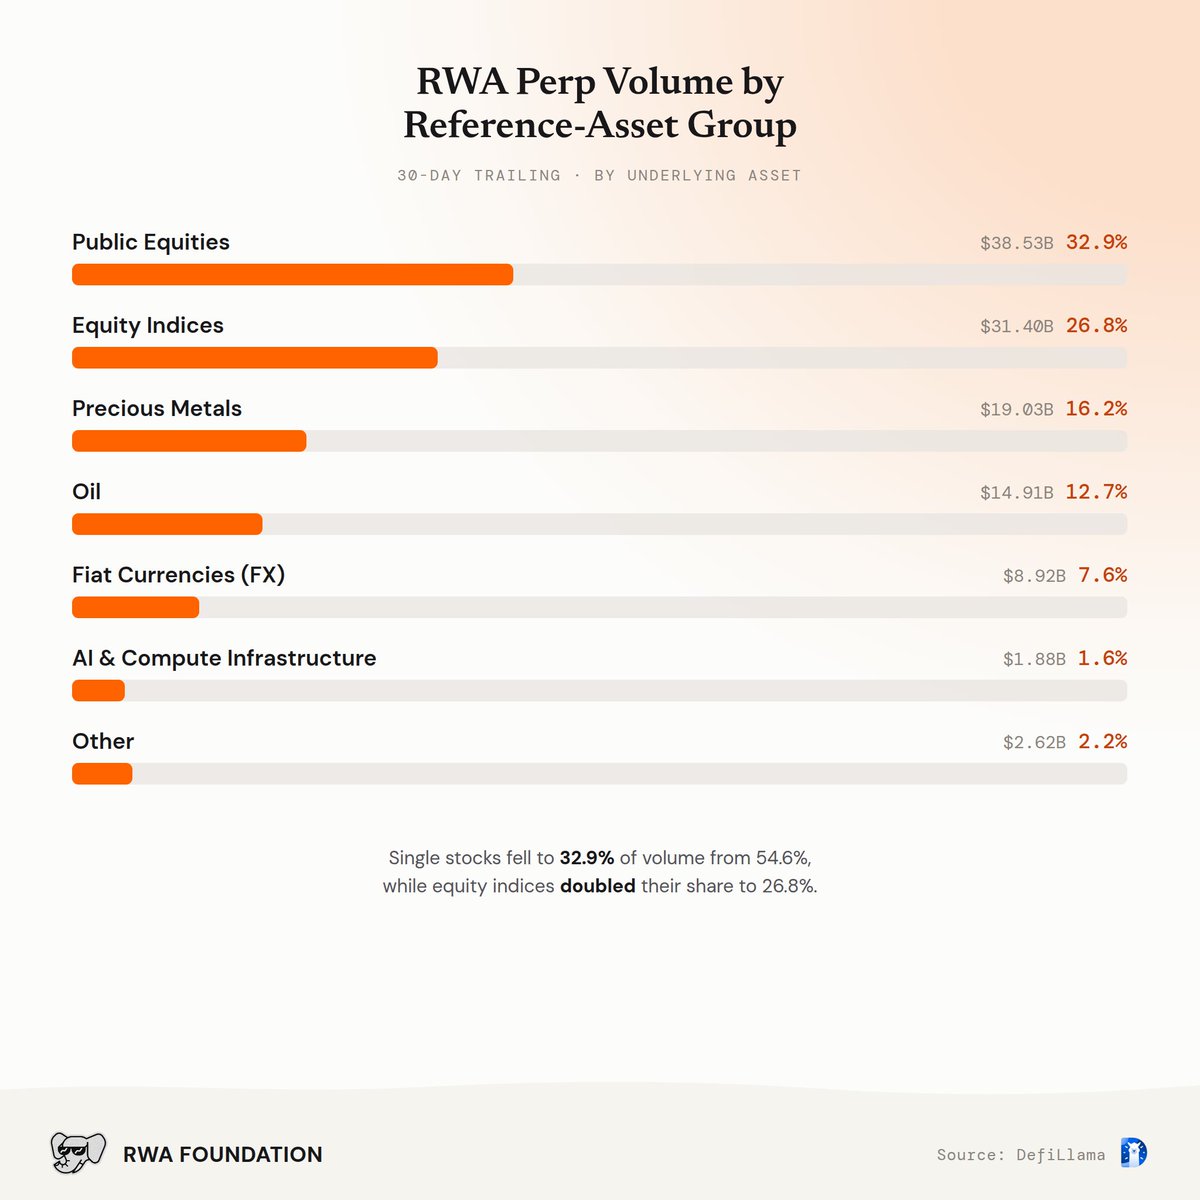
Grouping markets by underlying reference asset tells a similar story from a different angle. Public Equities lead at $38.53B (32.9%), followed by Equity Indices at $31.40B (26.8%), which doubled their share, Precious Metals at $19.03B (16.2%) and Oil at $14.91B (12.7%). Fiat Currencies contribute $8.92B (7.6%) and AI & Compute Infrastructure $1.88B (1.6%).
Public equities, equity indices, and precious metals together account for three in every four dollars of RWA perp volume, down from close to four in five last month.
07Top Individual Markets
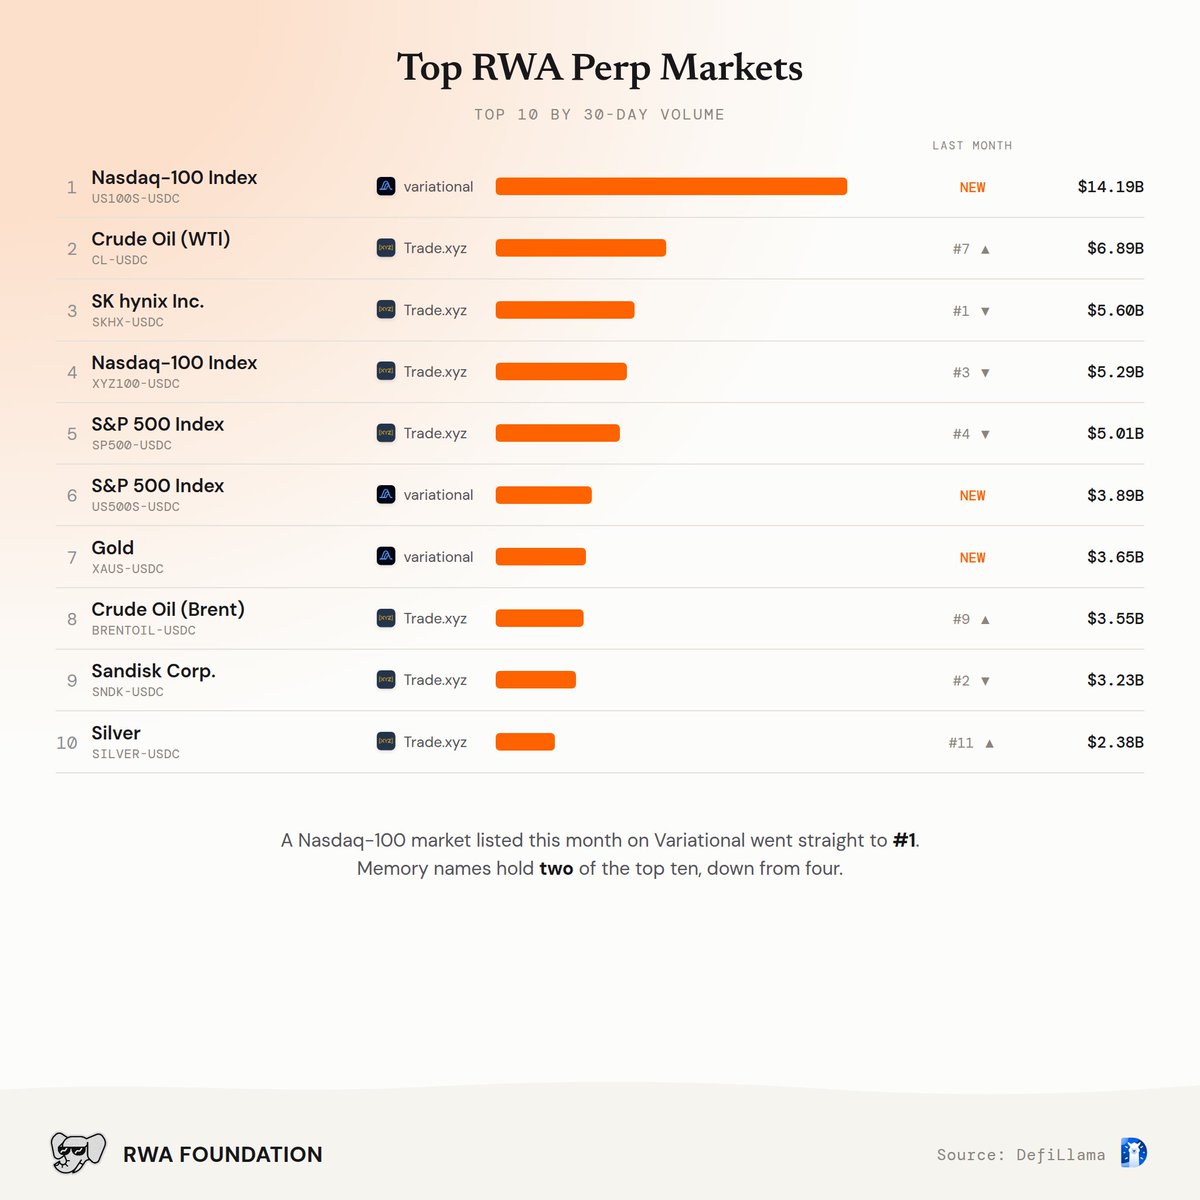
The largest market this month, Variational's Nasdaq-100 perp, did not exist a month ago and generated $14.19B, more than twice any other. Trade.xyz's WTI crude oil market ranks second at $6.89B, up 30%.
The memory-chip names that led last month have fallen sharply. SK hynix drops from first to third, Sandisk from second to ninth, and Micron out of the top ten. Across seven memory and semiconductor markets on Trade.xyz, volume fell 62.8%, and their share of the venue's volume fell from 45.7% to 29.6%.
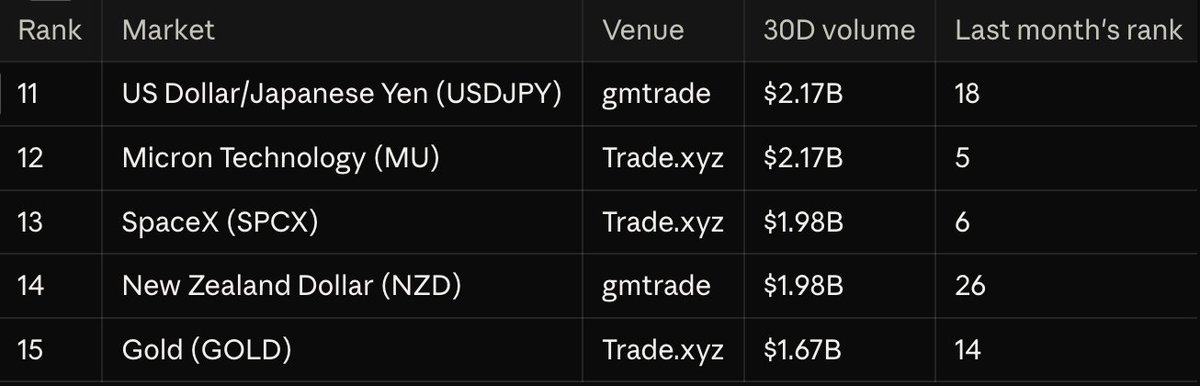
The top 15 is also less concentrated by venue: ten markets trade on Trade.xyz, down from fourteen, with three on Variational and two on gmtrade.
08Closing Statement
The RWA perpetuals market remains new and concentrated, but less so than a month ago. The memory and semiconductor exposure that drove last month's volume has unwound, and the activity replacing it came largely from new listings rather than deeper trading in established markets.
Positions tell a steadier story. Open interest rose 6.0%, and Trade.xyz, despite losing more than a third of its volume share, still holds nearly three-quarters of it. Whether Variational's new markets retain their volume beyond launch is the central question for next month.
09Methodology
- Windows. Current figures cover August 30 to September 28, 2026, compared against July 31 to August 29, recalculated on the same basis, so the prior total differs slightly from last month's published $128.4B.
- Venues. The report covers the 19 venues DefiLlama tracks as active and excludes centralized-exchange markets it has reclassified as inactive.
- Open interest. Figures are average daily open interest across each window.
- Fees. Estimated protocol fees are left out this month pending confirmation of DefiLlama's methodology.
- Asset classes. Asset classes follow DefiLlama's tags.
Disclaimer. All data in this report is sourced from DefiLlama's RWA perpetuals dataset via LlamaAI. Figures reflect DefiLlama's own coverage as of the report date, and other providers may track different venues or calculate figures differently. This report is for informational purposes only and does not constitute financial or investment advice.