
This is the Q3 2026 stablecoin edition of RWA Activity on the Terminal, a joint report from RWA Foundation and Token Terminal. It tracks how stablecoins moved over the third quarter by asset, issuer and chain, covering both market cap and holders.
All figures are taken strictly from Token Terminal as of October 1, 2026. Growth figures cover the trailing 90-day window ending on that date. No third-party data has been added, and no figures have been adjusted or estimated.
Market cap refers to circulating asset market cap as reported by Token Terminal, which for stablecoins equals outstanding supply. Holders refers to addresses holding a non-zero balance of a stablecoin. Chain figures include bridged supply.
01Overview
Stablecoin market cap stood at $300.9 billion on October 1, across 195 assets, 152 issuers and 47 chains. Holder addresses reached 308.4 million.
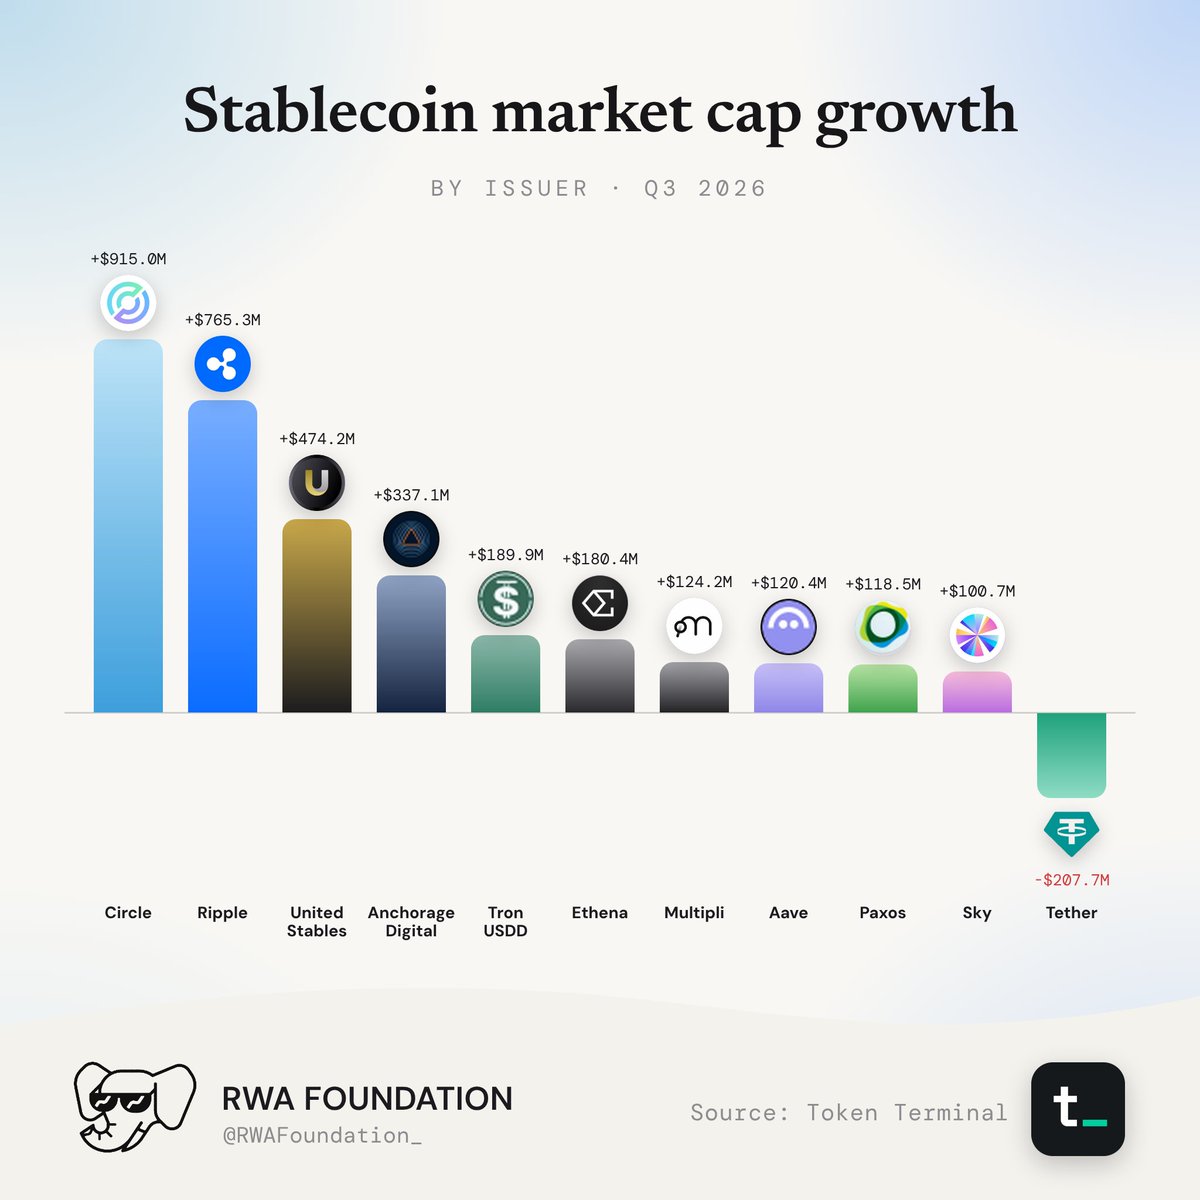
The biggest moves of the quarter were between chains. Ethereum's stablecoin market cap fell $4.9 billion over 90 days while Tron's rose $5.0 billion. Among issuers, the largest one shrank. Tether's market cap fell $207.7 million, while Circle, Ripple and United Stables led growth.
02Growth by Asset
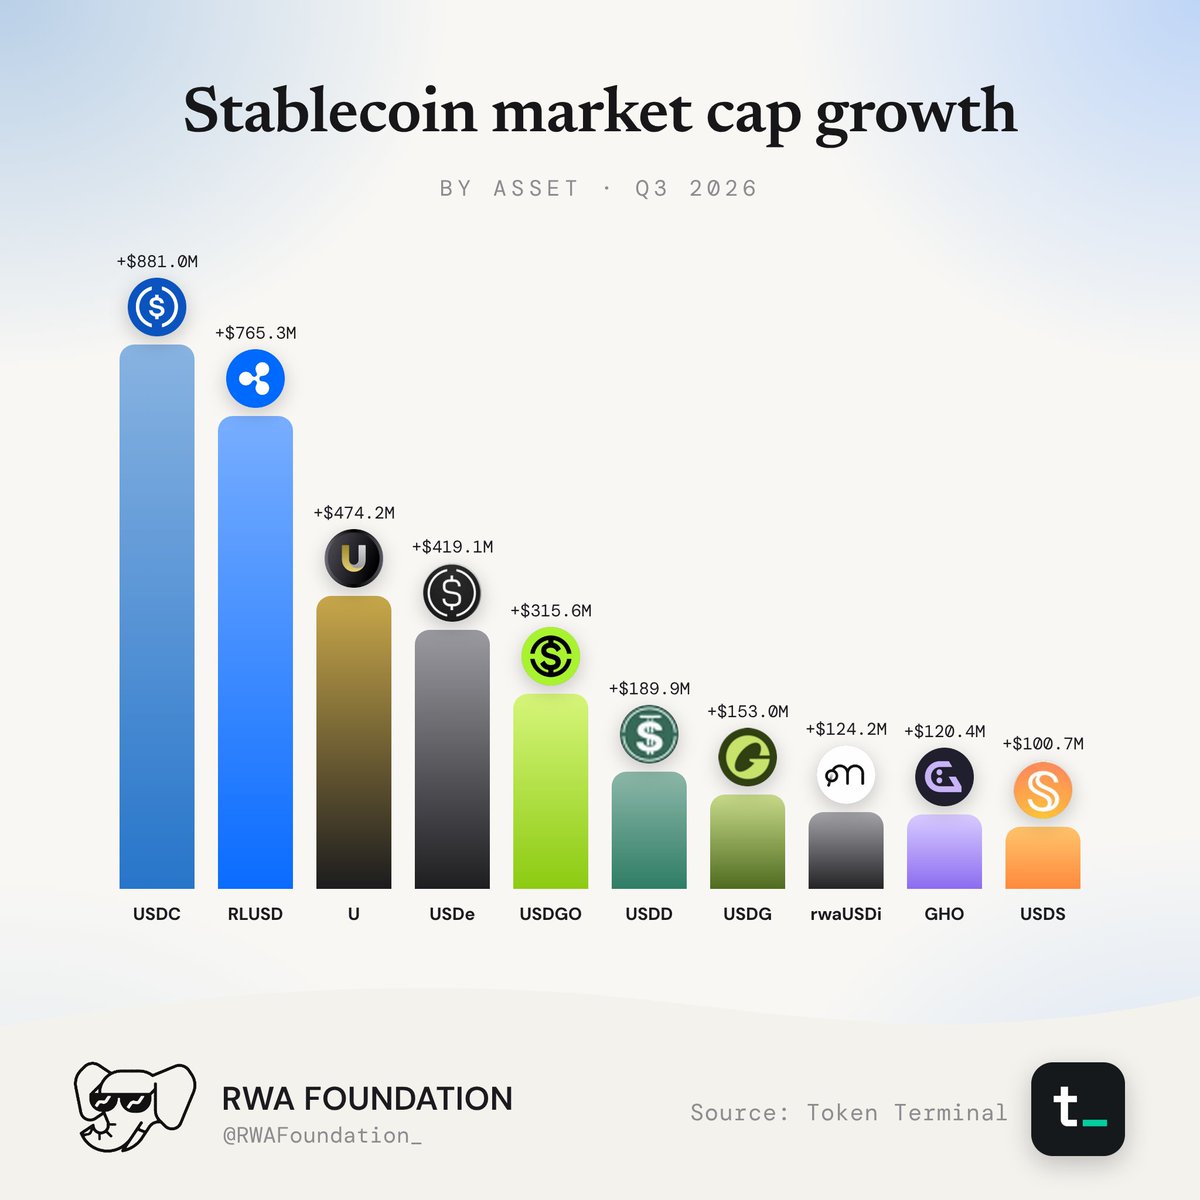
USDC added $881.0 million over 90 days, more than any other stablecoin. Ripple's RLUSD was close behind at $765.3 million, followed by United Stables' U (+$474.2 million) and Ethena's USDe (+$419.1 million). USDGO (+$315.6 million) and USDD (+$189.9 million) came next. USDG (+$153.0 million), rwaUSDi (+$124.2 million), GHO (+$120.4 million) and USDS (+$100.7 million) completed the top 10, which added about $3.5 billion combined.
Several of the fastest growers are small. RLUSD holds 0.8% of stablecoin supply and U holds 0.5%, yet they ranked second and third. USDT, which holds 61.0% of supply, is not in the top 10.
03Growth by Issuer
Circle added $915.0 million over 90 days, more than any other issuer. Ripple (+$765.3 million) and United Stables (+$474.2 million) were second and third, followed by Anchorage Digital (+$337.1 million). Tron USDD (+$189.9 million) and Ethena (+$180.4 million) came next. Multipli (+$124.2 million), Aave (+$120.4 million), Paxos (+$118.5 million) and Sky (+$100.7 million) completed the top 10, which added about $3.3 billion combined. Tether, the largest issuer, moved the other way, down $207.7 million over the quarter.
04Market Share by Issuer
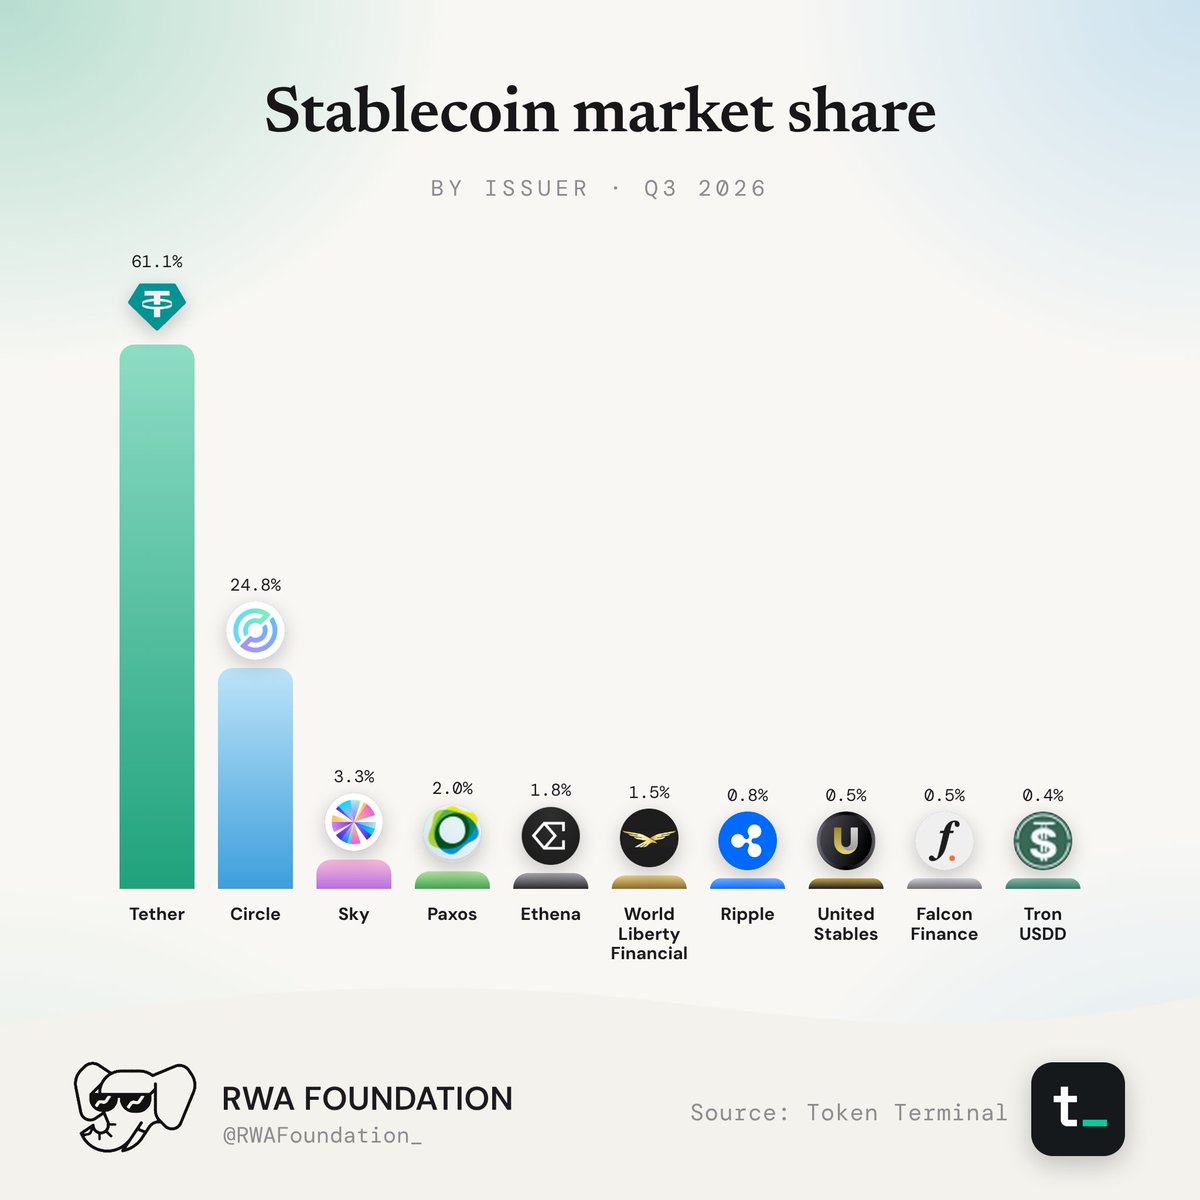
Tether (61.1%) and Circle (24.8%) hold 85.9% of stablecoin supply between them, close to the 85.8% in our September report. Sky (3.3%), Paxos (2.0%), Ethena (1.8%) and World Liberty Financial (1.5%) follow. Ripple (0.8%), United Stables (0.5%), Falcon Finance (0.5%) and Tron USDD (0.4%) complete the top 10. The remaining 142 issuers hold 3.4% combined.
05Growth by chain
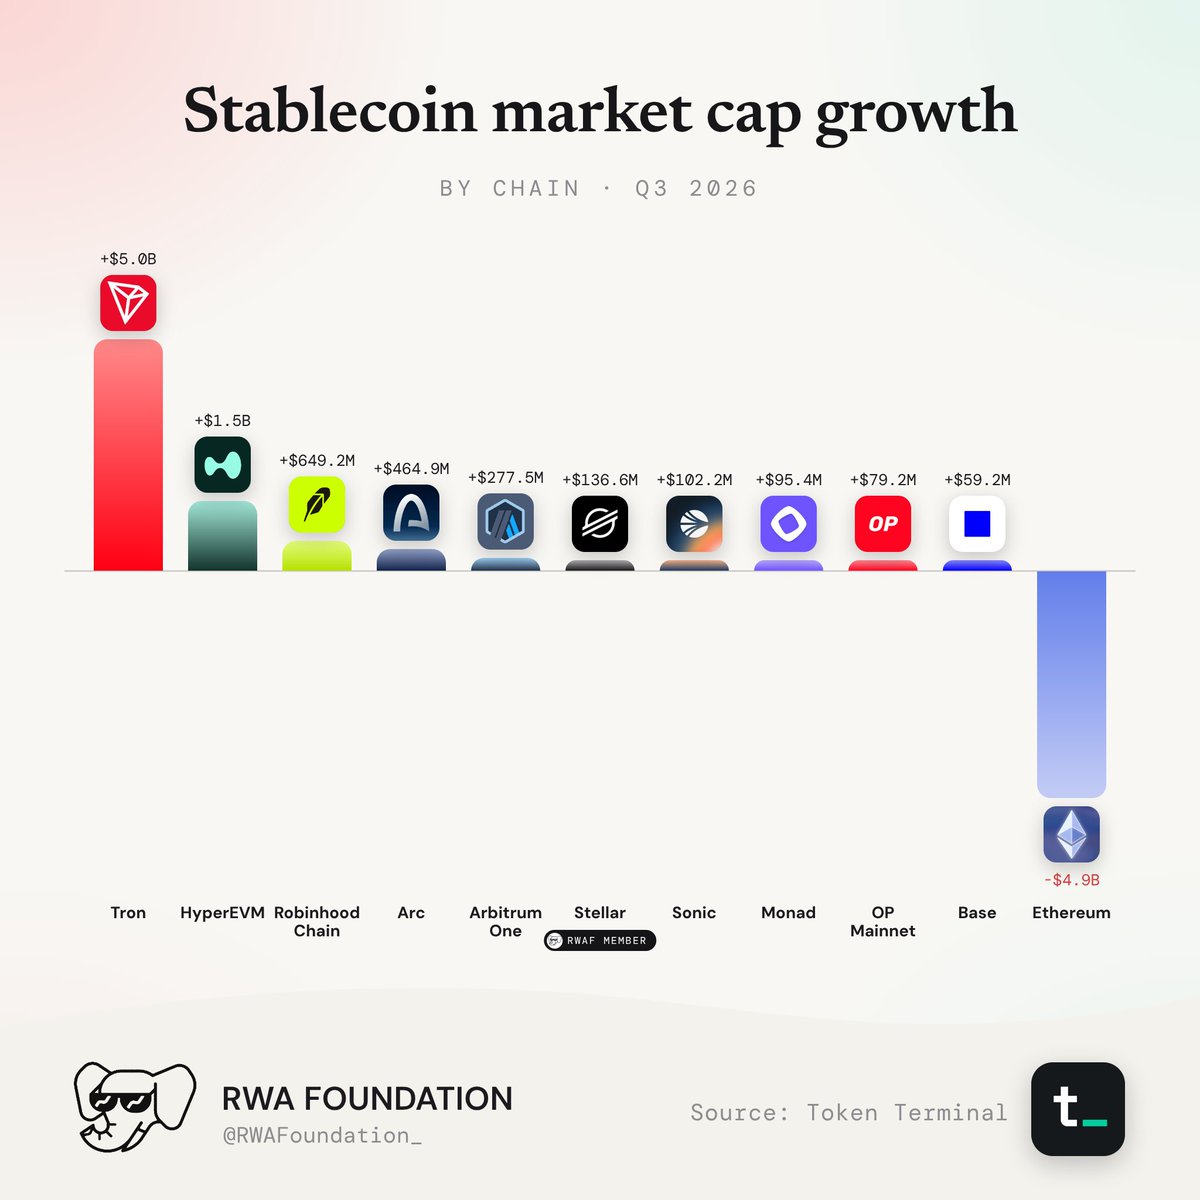
Tron added $5.0 billion over 90 days, a 5.6% rise that took its stablecoin market cap to $93.9 billion. HyperEVM was second at $1.5 billion, up 28.3% to $7.0 billion. Robinhood Chain (+$649.2 million) and Arc (+$464.9 million), both newer networks, were third and fourth. Arbitrum One added $277.5 million. Stellar (+$136.6 million), Sonic (+$102.2 million), Monad (+$95.4 million), OP Mainnet (+$79.2 million) and Base (+$59.2 million) completed the top 10. The top 10 added about $8.4 billion combined, and Tron took about 60% of it.
Ethereum went the other way. Its' stablecoin market cap fell $4.9 billion over the quarter, almost exactly the size of Tron's gain. Ethereum still hosts 54.2% of all stablecoin supply, against Tron's 31.2%.
06Holders by Asset
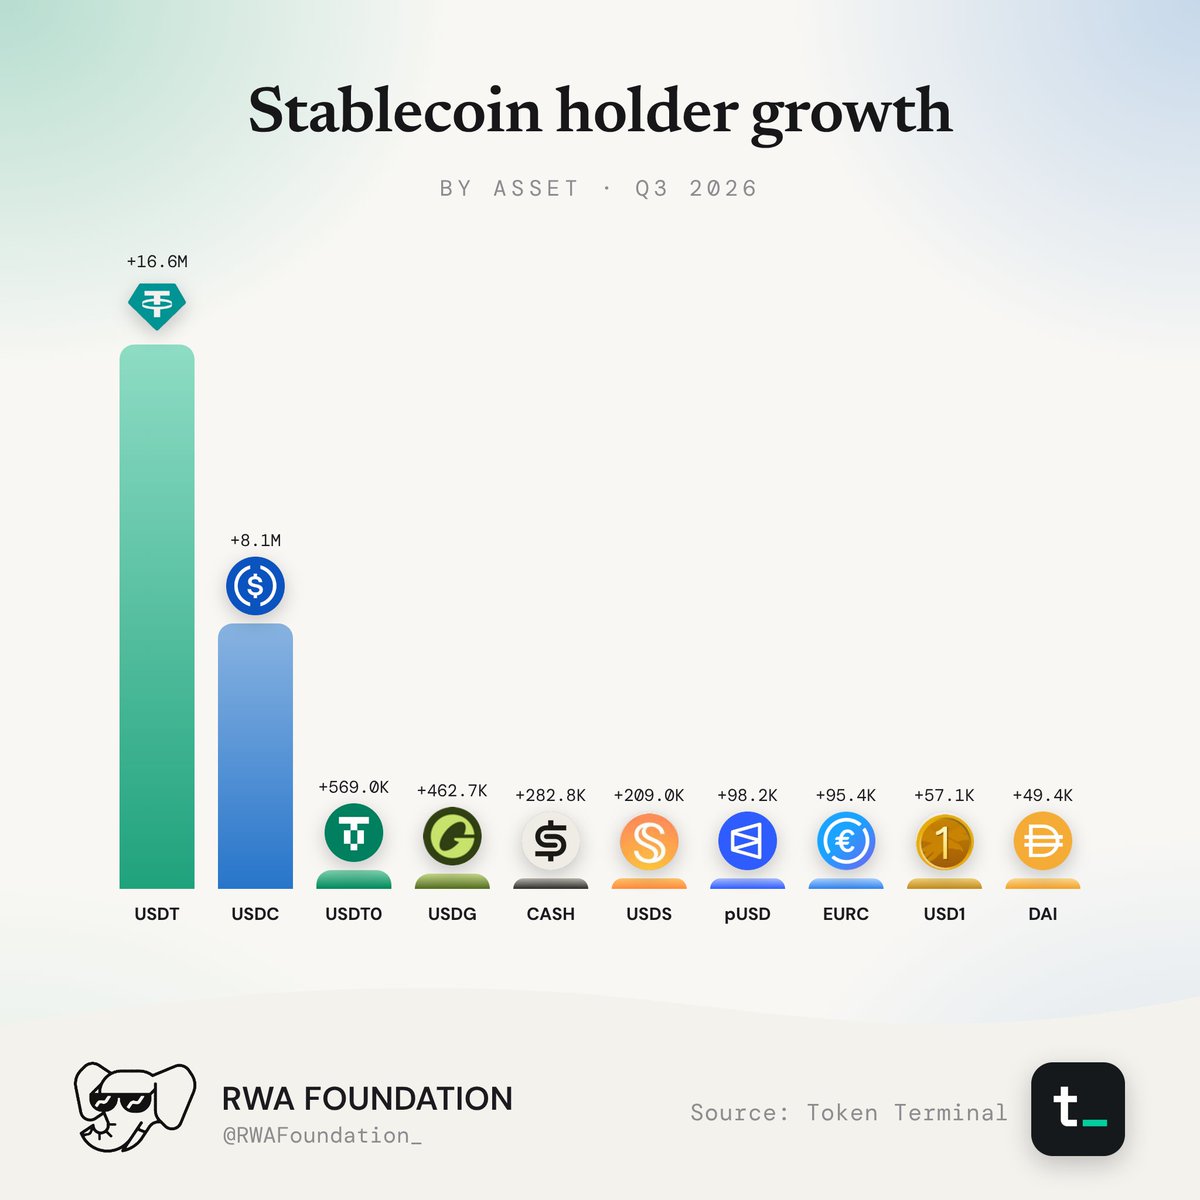
USDT added 16.6 million holder addresses over 90 days and USDC added 8.1 million. USDT0 was third with 569,000. USDG (+462,700), Phantom's CASH (+282,800) and USDS (+209,000) came next. Polymarket's pUSD (+98,200), EURC (+95,400), USD1 (+57,100) and DAI (+49,400) completed the top 10. EURC was the only non-USD stablecoin in the list.
07Holders by Issuer
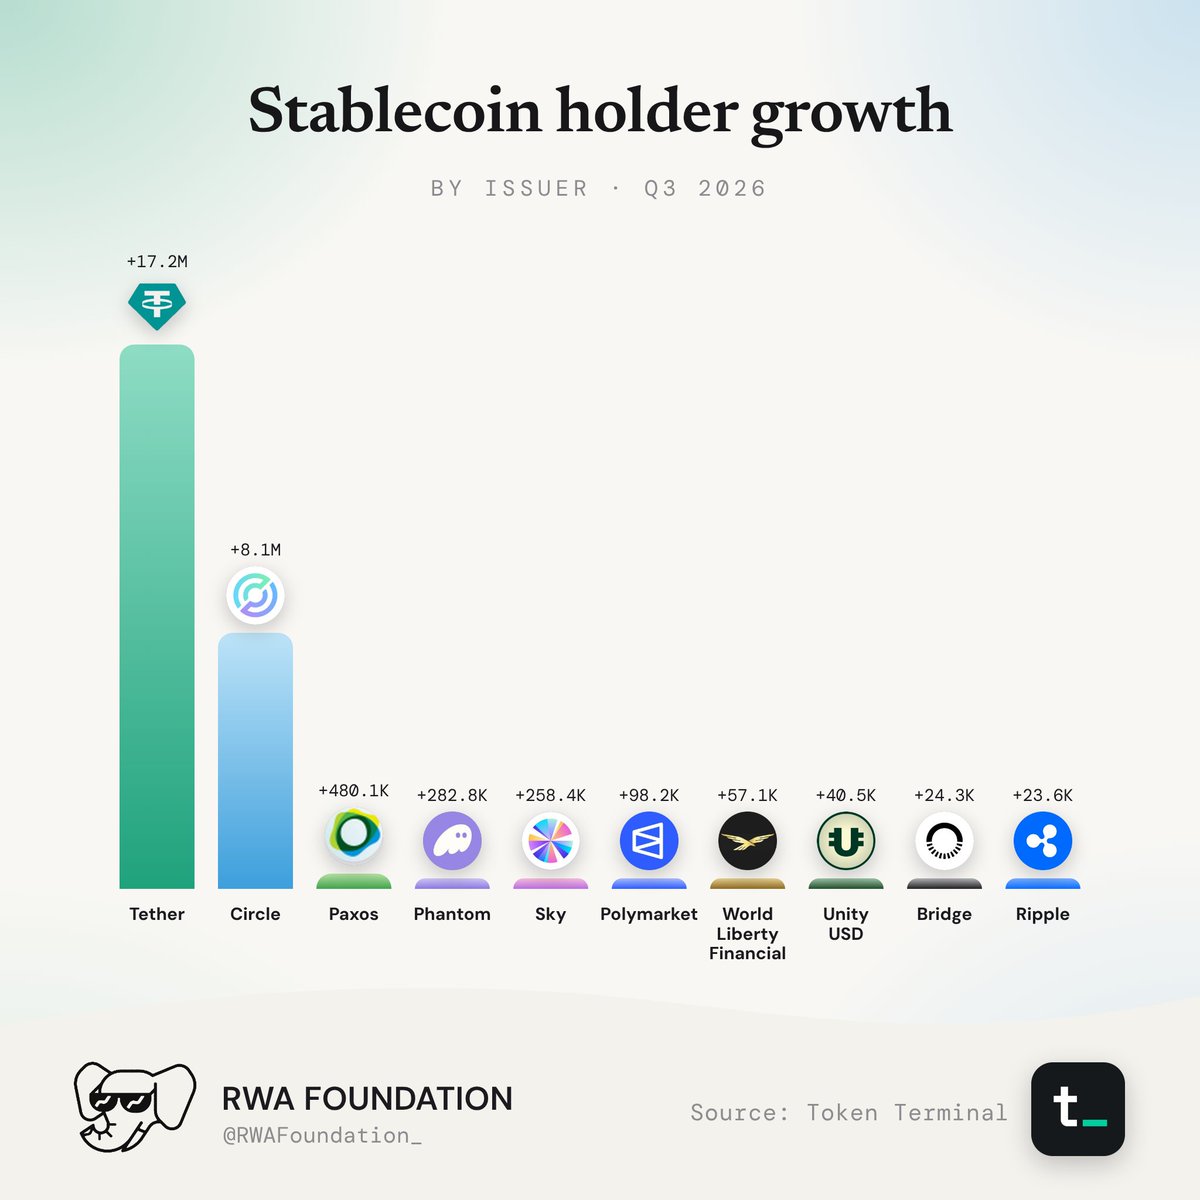
Tether added 17.2 million holder addresses and Circle added 8.1 million. Together that is about 95% of the top 10's 26.6 million. Paxos (+480,100), Phantom (+282,800) and Sky (+258,400) were next. Polymarket (+98,200), World Liberty Financial (+57,100), Unity USD (+40,500), Bridge (+24,300) and Ripple (+23,600) completed the top 10. Tether and Circle now account for 91.7% of all stablecoin holder addresses.
Holder growth and market cap growth pointed in opposite directions at the top. Tether lost market cap but added more holders than any other issuer. Ripple added the second-most market cap but ranked tenth for new holders. Wallet and app issuers such as Phantom, Polymarket and Bridge made the list again.
08Holders by Chain
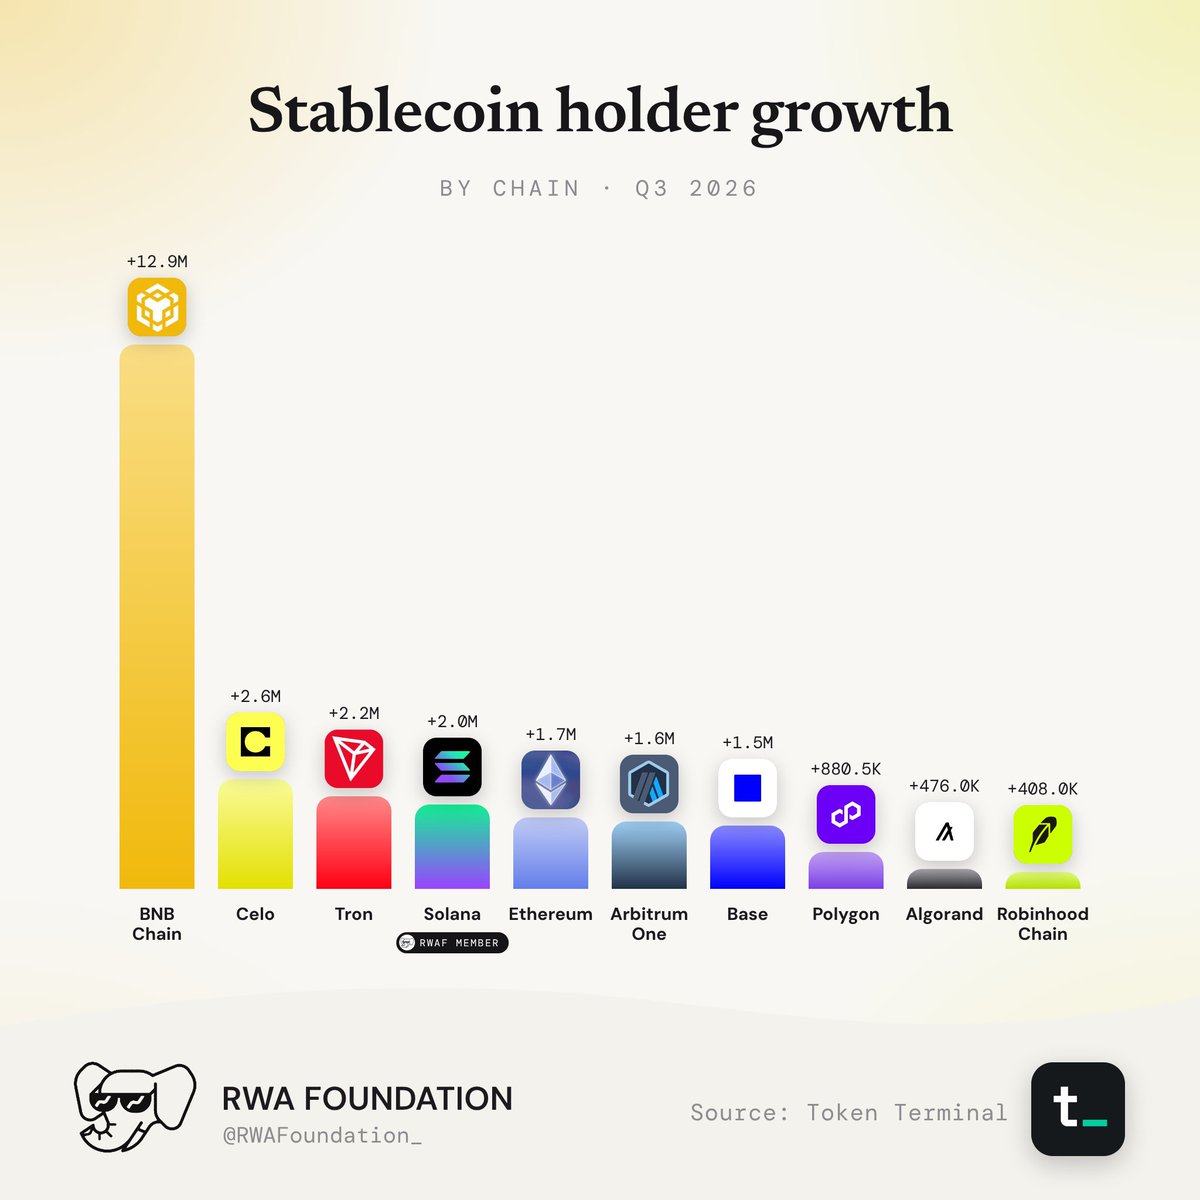
BNB Chain added 12.9 million holder addresses, nearly five times the next chain and about half the top 10's 26.3 million. Celo (+2.6 million), Tron (+2.2 million) and Solana (+2.0 million) followed. Ethereum added 1.7 million holders despite its fall in market cap, ahead of Arbitrum One (+1.6 million) and Base (+1.5 million). Polygon (+880,500), Algorand (+476,000) and Robinhood Chain (+408,000) completed the top 10.
09Where Supply Sits and Where Holders Are
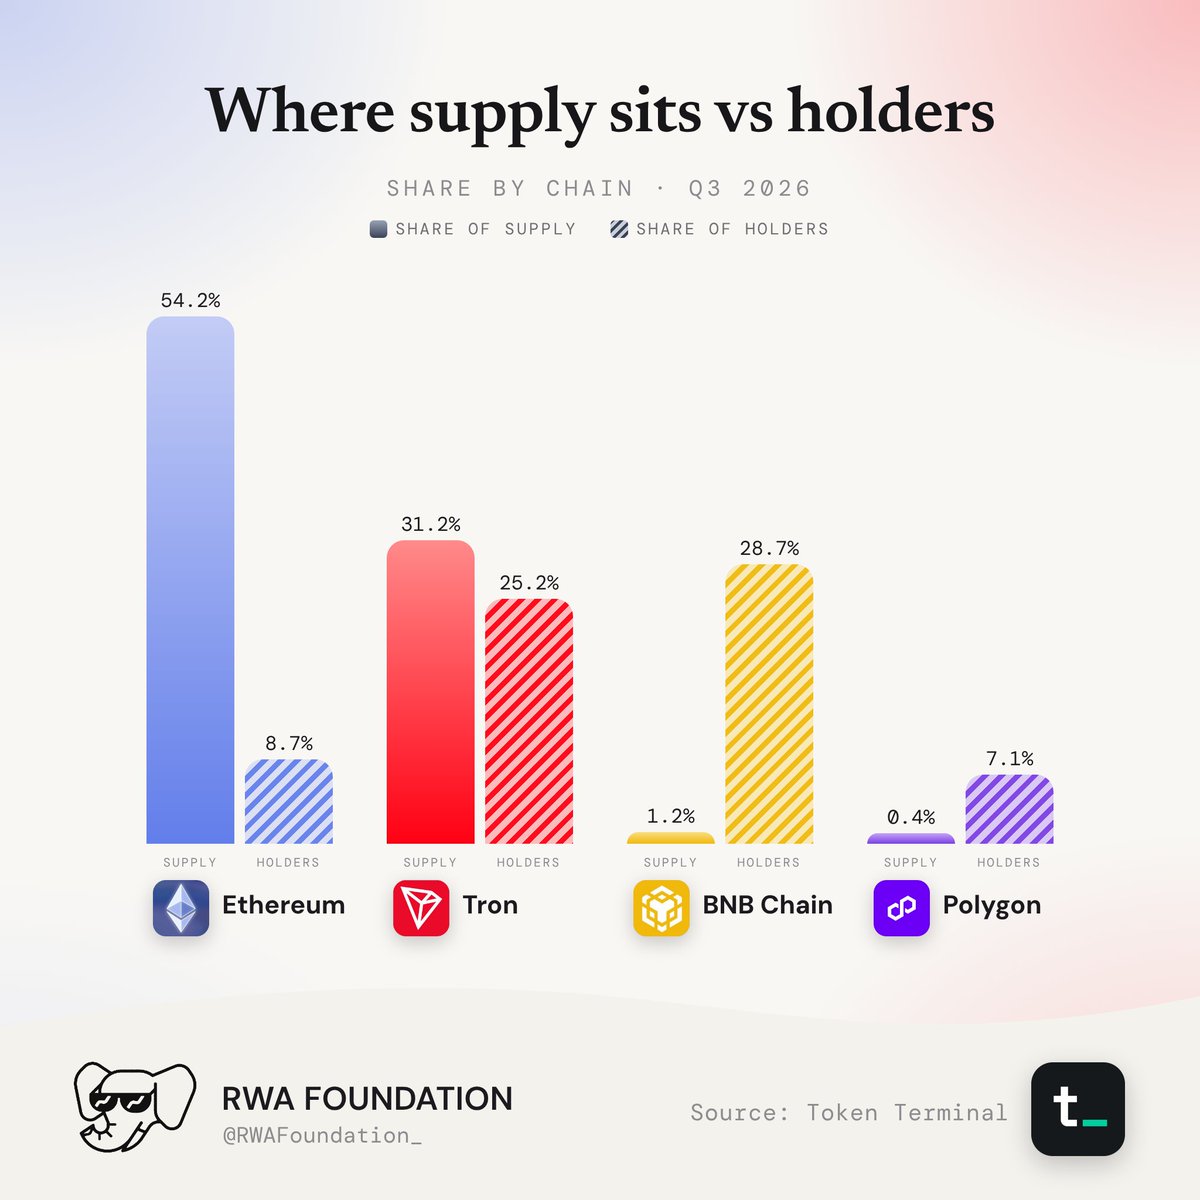
The chains holding the most stablecoin supply are not the chains with the most holders.
- Ethereum hosts 54.2% of supply but 8.7% of holder addresses.
- BNB Chain hosts 1.2% of supply but 28.7% of holders.
- Polygon hosts 0.4% of supply but 7.1% of holders.
- Tron is the only chain near the top of both, with 31.2% of supply and 25.2% of holders.
10Beyond the Dollar
USD stablecoins account for 99.3% of holder addresses, and they added 26.2 million over the quarter. Euro stablecoins added 94,600, the most of any other currency, followed by the Argentine peso (+12,400) and the Japanese yen (+4,000).
11Conclusion
The quarter's largest moves were between chains, not issuers. Ethereum lost $4.9 billion in stablecoin supply and Tron gained $5.0 billion, while newer networks such as HyperEVM, Robinhood Chain and Arc posted some of the biggest gains.
Growth by issuer went mostly to smaller players. Circle led, but Ripple and United Stables, with under 1% of supply each, ranked second and third. Tether, the largest issuer, shrank.
Holders told a different story. Tether and Circle took about 95% of new holder addresses in the top 10, and BNB Chain took about half by chain. The issuers and chains attracting the most capital are often not the ones attracting the most holders, the same split we found in September, now confirmed over a full quarter.
All figures are sourced strictly from Token Terminal as of October 1, 2026, and reflect the trailing 90-day window ending on that date. This report is for informational purposes only and is not investment advice.