
This is the Q3 2026 tokenized credit edition of RWA Activity on the Terminal, a joint report from RWA Foundation and Token Terminal. It tracks how tokenized credit funds moved over the third quarter by asset, issuer and chain, covering both market cap and holders.
All figures are taken strictly from Token Terminal as of October 1, 2026. Growth figures cover the 90-day window from July 3 to October 1. No third-party data has been added, and no figures have been adjusted or estimated.
Market cap refers to circulating asset market cap as reported by Token Terminal, and covers native deployments only, excluding bridged supply. Holders refers to addresses holding a non-zero balance, including bridged deployments, summed across assets without removing duplicates.
01Overview
Tokenized credit market cap stood at $6.17 billion on October 1, down $175.5 million (2.8%) from $6.35 billion on July 3. Market cap was spread across 64 assets, 13 issuers and 16 chains. Holder addresses rose 12.1% to 28,840, across 90 assets, 22 issuers and 18 chains.
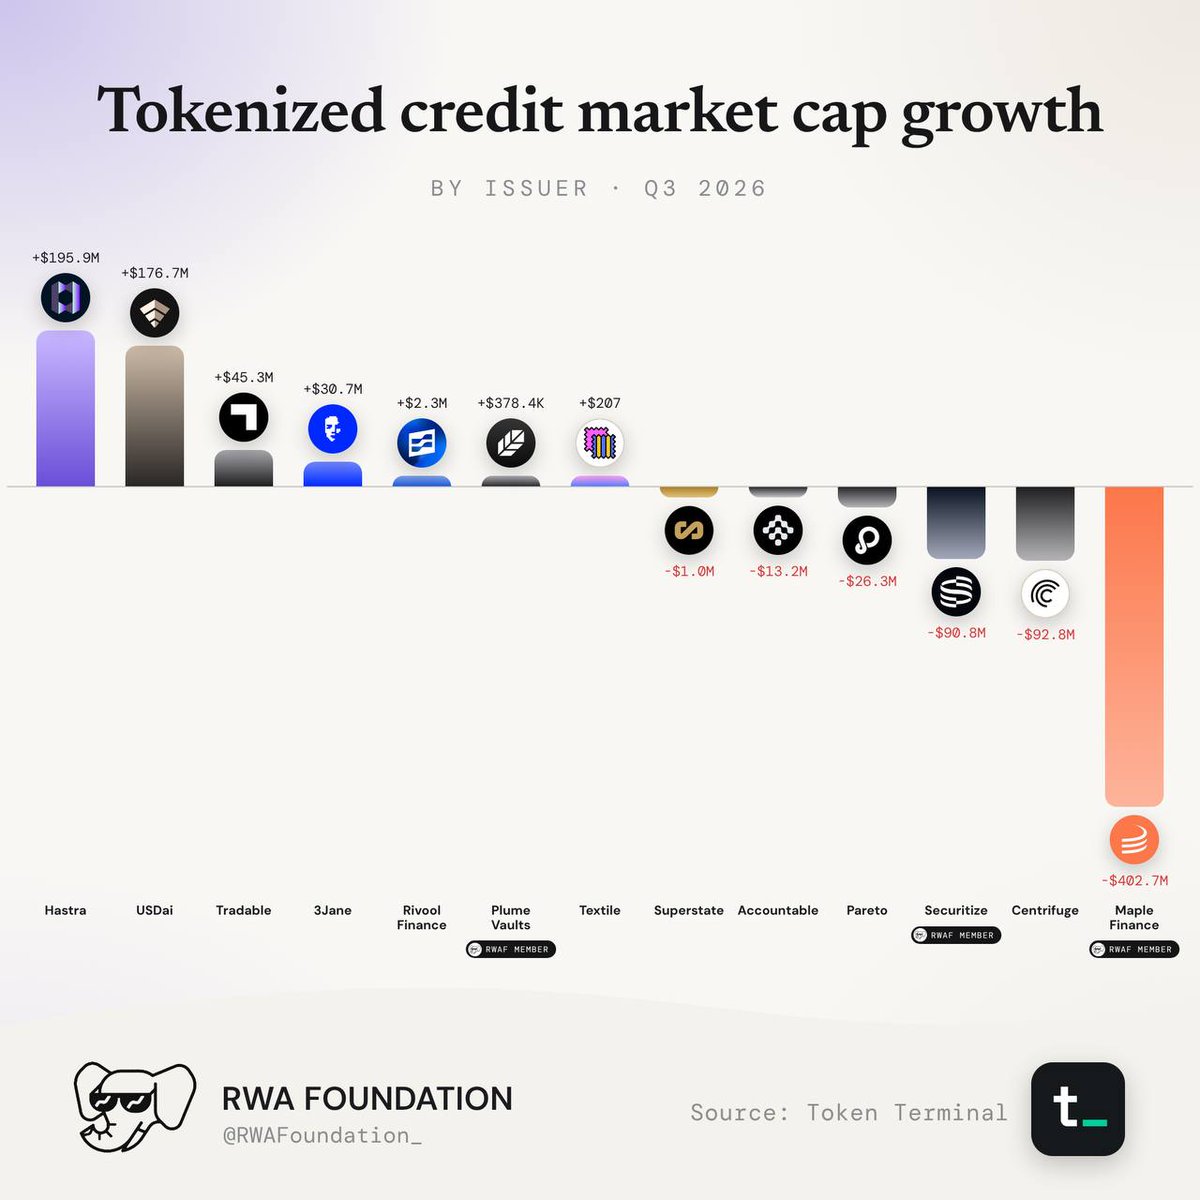
The sector shrank in value but grew in holders. Maple Finance lost $402.7 million in market cap while adding 2,160 holder addresses, about 69% of the sector's net growth. Hastra and USDai led market cap growth, adding $372.5 million between them.
02Growth by asset
Hastra's PRIME added $195.9 million over 90 days, more than any other credit asset. USDai's sUSDai (+$176.7 million) and Maple's syrupUSDG (+$135.6 million) followed, and 3Jane's USD3 added $30.7 million. The rest of the top 10 were Tradable's loan-level tokens: PC188814458 (+$38.5 million), PC0000053 (+$33.0 million), PC0016245 (+$25.6 million), PC3729409 (+$20.6 million), PC0000027 (+$16.1 million) and PC0000049 (+$16.0 million). The top 10 added about $689 million combined.
03Market share by issuer
Tradable (36.9%) and Maple Finance (23.5%) hold 60.4% of tokenized credit market cap between them. Centrifuge (9.9%), Hastra (9.6%), USDai (7.6%) and Securitize (6.2%) follow. Pareto (2.0%), 3Jane (1.8%), Accountable (1.7%) and Rivool Finance (0.4%).
04Growth by chain
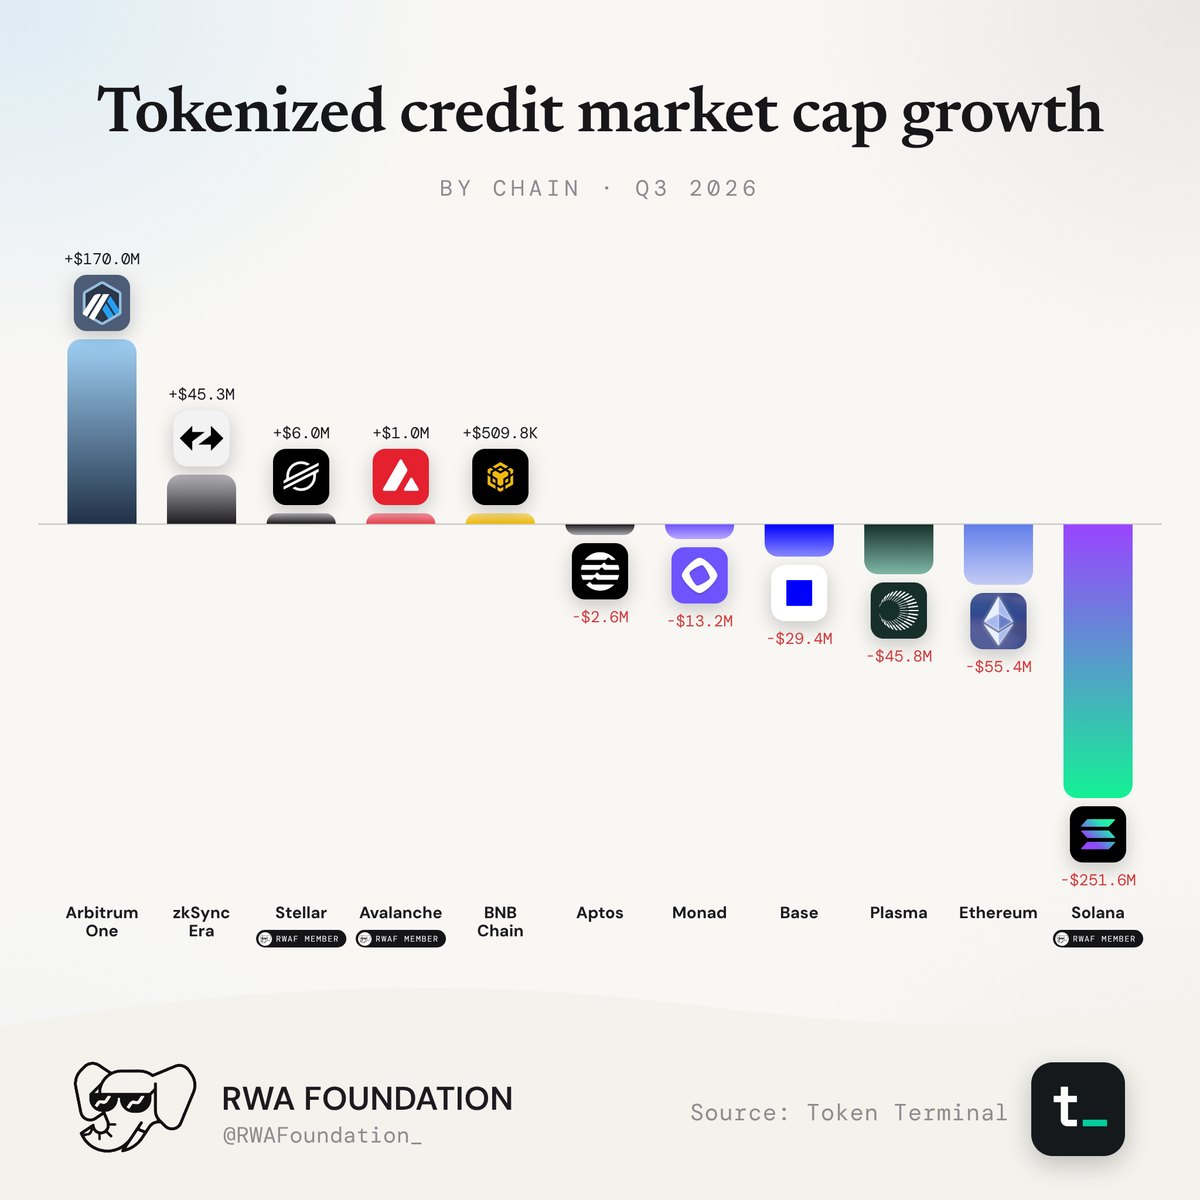
Arbitrum One added $170.0 million over 90 days, nearly doubling its credit market cap to $342.6 million. zkSync Era was second at $45.3 million, matching Tradable's growth exactly. Stellar added $6.0 million (+18.6%) and Avalanche $1.0 million.
05Holders by asset
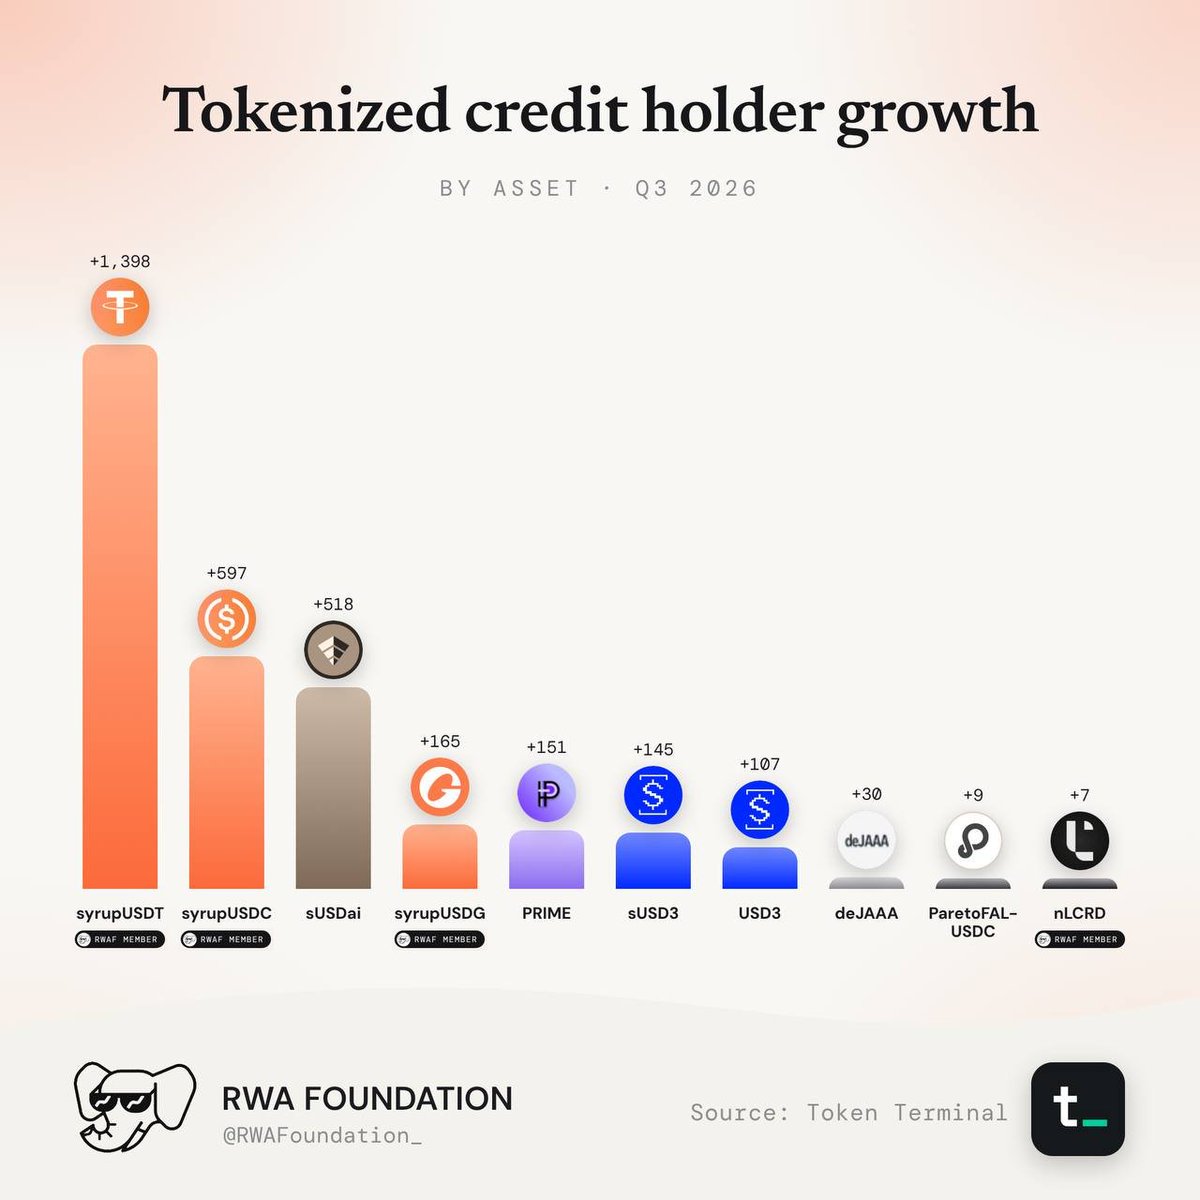
syrupUSDT added 1,398 holder addresses over 90 days, a 16.5% rise, while its market cap fell 44.7%. syrupUSDC added 597 and sUSDai 518. syrupUSDG (+165), PRIME (+151), sUSD3 (+145) and USD3 (+107) came next. deJAAA (+30), ParetoFAL-USDC (+9) and nLCRD (+7) completed the top 10. Maple's three syrup tokens took 2,160 of the top 10's 3,127.
06Holders by issuer
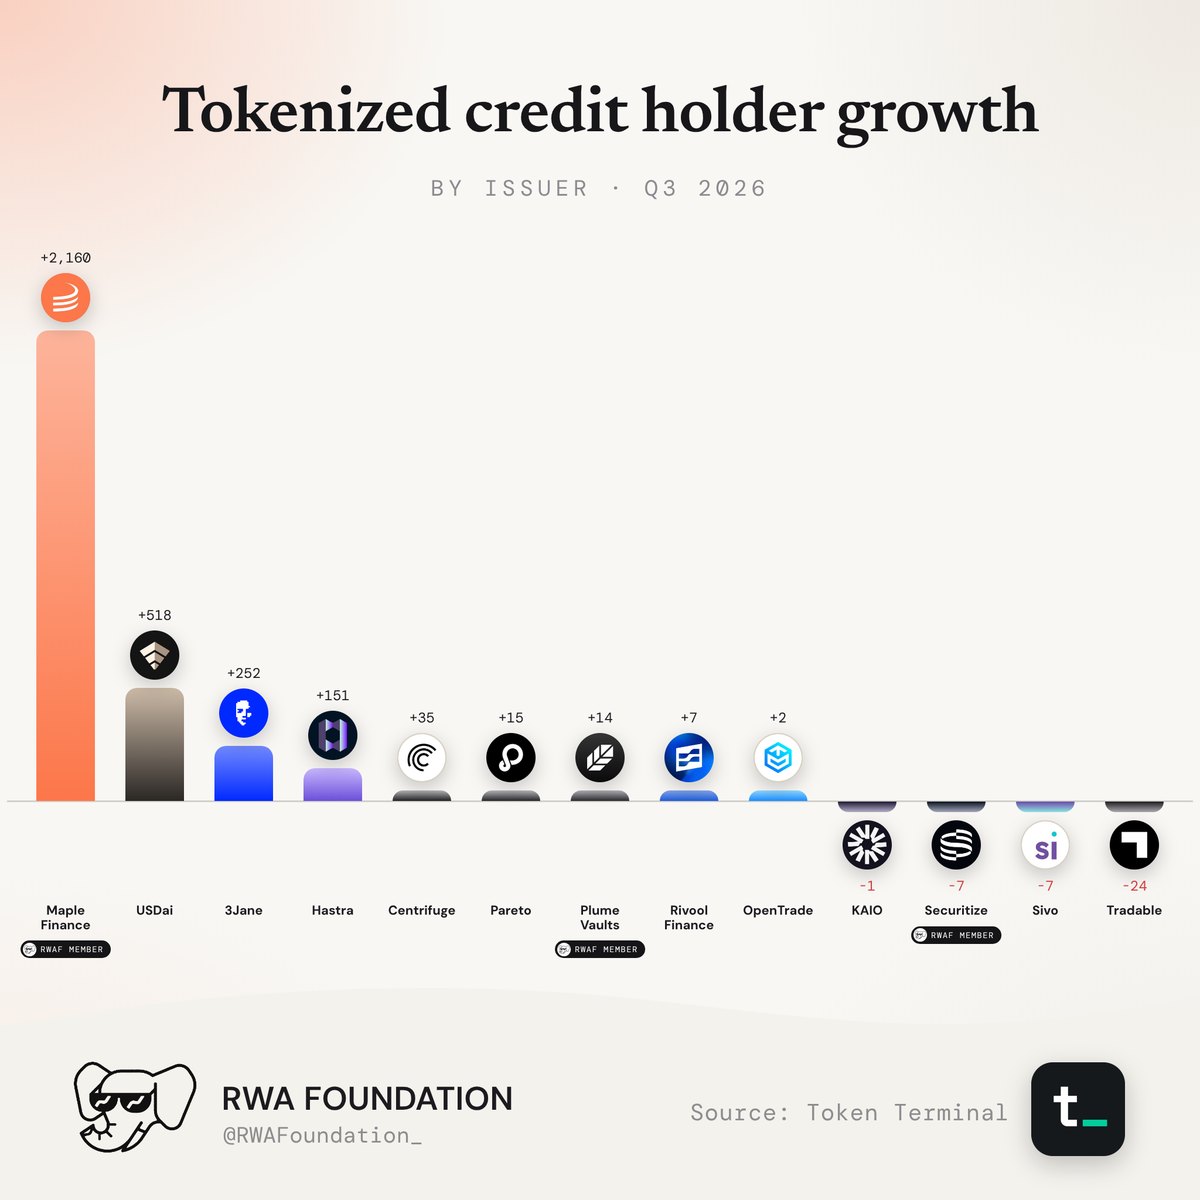
Maple Finance added 2,160 holder addresses, more than four times the next issuer, and now accounts for 64.0% of all credit holder addresses. USDai (+518), 3Jane (+252) and Hastra (+151) followed. Centrifuge (+35), Pareto (+15), Plume Vaults (+14), Rivool Finance (+7) and OpenTrade (+2) were the only other issuers to grow. Tradable lost 24 holder addresses and Securitize lost 7.
Holder growth and market cap growth split at the top. Maple lost more market cap than any other issuer and added the most holders. Tradable holds the most market cap but lost holders.
07Holders by chain
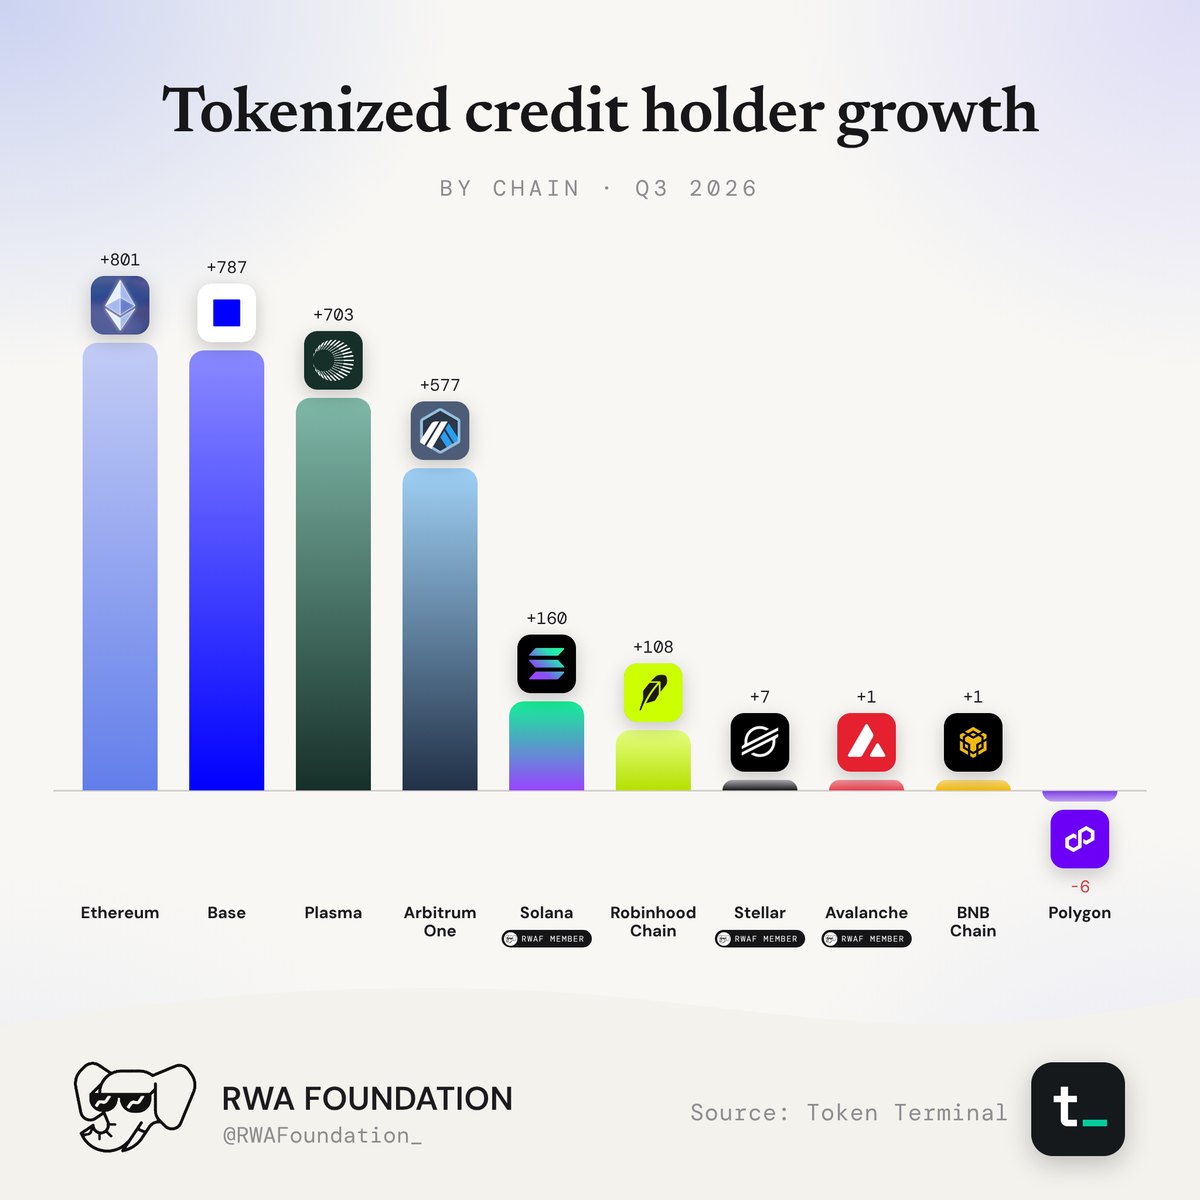
Ethereum added 801 holder addresses, narrowly ahead of Base (+787) and Plasma (+703). Arbitrum One (+577), Solana (+160) and Robinhood Chain (+108) followed. Stellar added 7, Avalanche and BNB Chain added 1 each, and Polygon lost 6.
Base and Plasma both lost more than half their credit market cap over the quarter, yet added the second and third most holders.
08Where capital sits and where holders are
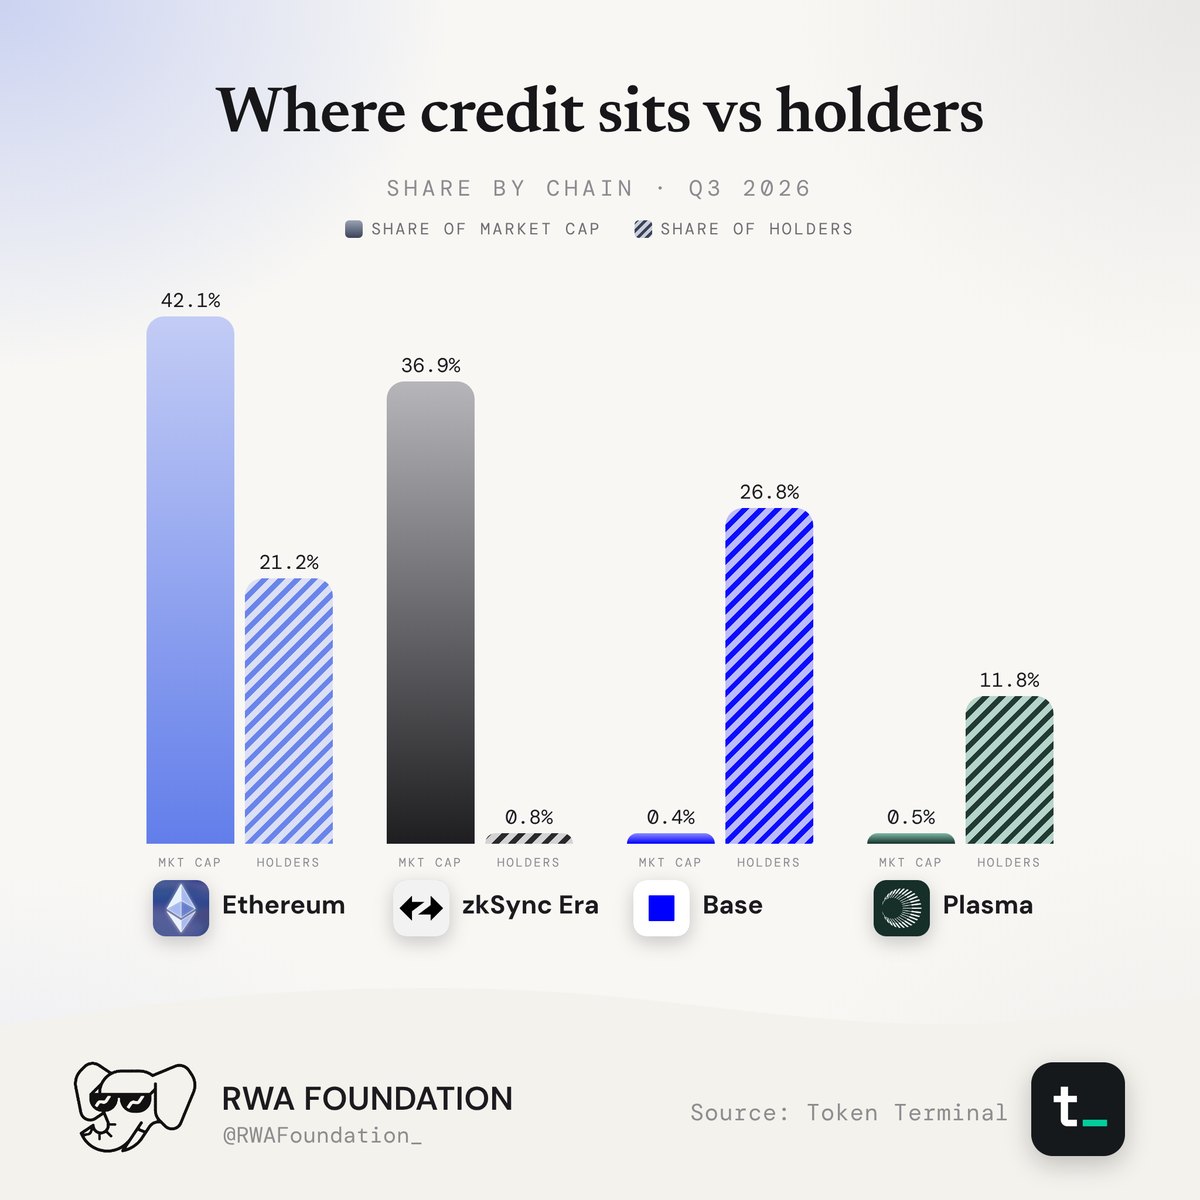
The chains holding the most credit are not the chains with the most holders.
- Ethereum hosts 42.1% of credit market cap and 21.2% of holder addresses.
- zkSync Era hosts 36.9% of market cap but 0.8% of holders.
- Base hosts 0.4% of market cap but 26.8% of holders, the most of any chain.
- Plasma hosts 0.5% of market cap but 11.8% of holders.
The same split shows by issuer. Tradable holds 36.9% of market cap and 0.8% of holder addresses. Maple holds 23.5% of market cap and 64.0% of holders.
09Two kinds of credit token
Tradable issues individual loans and notes on zkSync Era, such as senior secured term notes and project tranches. These tokens carry the largest share of the sector's capital but few holders, and they move loan by loan. One, a LatAm residential senior secured term loan, went from $37.0 million to zero over the quarter.
Maple, USDai, Hastra and 3Jane issue pooled yield tokens held by thousands of addresses across several chains. Together they accounted for 3,081 of the sector's 3,117 net new holder addresses.
10Conclusion
Tokenized credit shrank 2.8% in market cap over the quarter but grew 12.1% in holder addresses. The decline was concentrated. Maple, Centrifuge and Securitize lost $586.2 million combined, while Hastra and USDai added $372.5 million.
Holders moved the other way. Maple lost the most market cap and gained the most holders, taking about 69% of the sector's new holder addresses. By chain, Base and Plasma lost more than half their market cap while adding the second and third most holders.
As with stablecoins, the issuers and chains holding the most capital are not the ones attracting the most holders. In credit the gap is wider: the largest issuer by market cap holds under 1% of holder addresses.
All figures are sourced strictly from Token Terminal as of October 1, 2026, and reflect the 90-day window ending on that date. This report is for informational purposes only and is not investment advice.